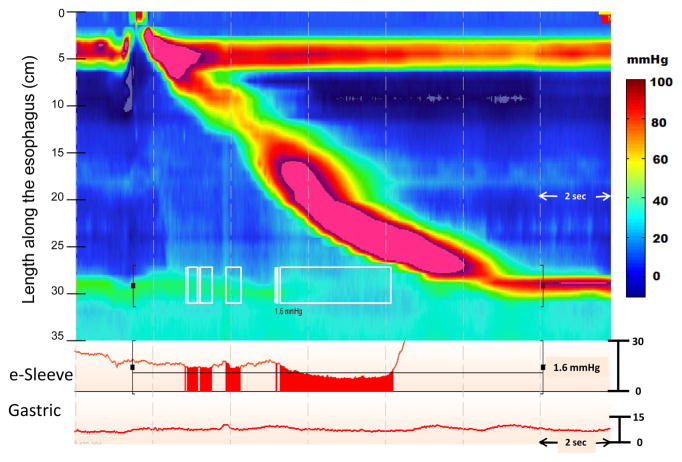
Figure 1.
IRP calculation for a normal swallow. The IRP is a complex metric as it involves accurately localizing the margins of the EGJ, demarcating the time window following deglutitive upper sphincter relaxation within which to anticipate EGJ relaxation to occur and then applying an e-sleeve measurement within that 10 second time box (highlighted by the black brackets). The e-sleeve is referenced to gastric pressure and provides a measure of the highest pressure through the axial domain at an instant in time and is plotted as a line tracing. The IRP is presented as the mean value of the four seconds during which the e-sleeve value is least. These time points are demarcated by the white boxes on the EPT plot and by the shaded red area noted on the red line tracing of the EGJ. In this example, the 4 second IRP is 1.6 mmHg which is slightly higher than intragastric pressure.

