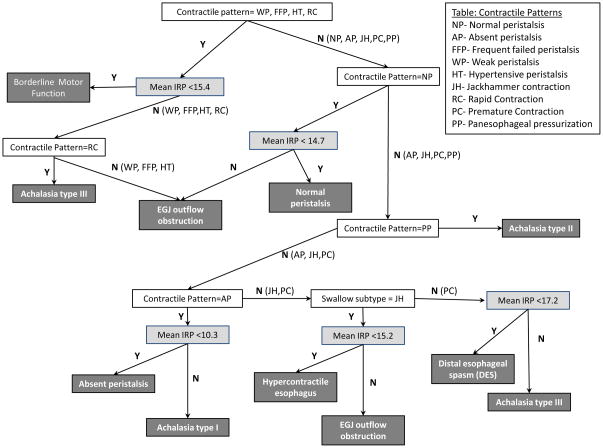
Figure 4.
The hierarchy of the Classification and Regression Tree (CART) model starts from the top with terminal nodes at the bottom. Codes for contractile patterns are listed in the top text box and described in Table 1. The CART model utilized contractile patterns (white boxes) and best-fit IRP cut-off values (light gray boxes) to best distinguish the Chicago Classification diagnoses (dark gray boxes). Note that the achalasia type II pattern did not require a distinct IRP cut-off as the swallow pattern was pathognomonic for this achalasia subtype.

