
Figure 2.
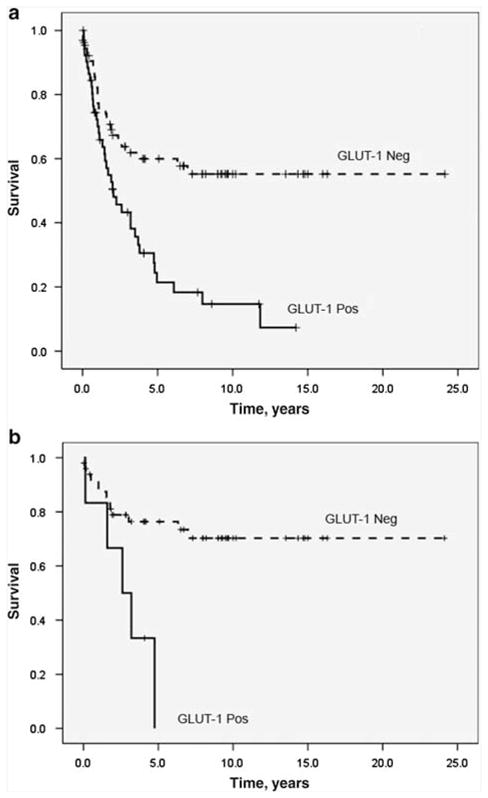
Overall survival analysis utilizing Kaplan–Meier method. There is a statistically significant curve separation between GLUT-1-positive and GLUT-1-negative cases for the whole group of neuroendocrine carcinomas (a) (P < 0.001) and carcinoids (b) (P = 0.01). Pos, GLUT-1-positive cases; Neg, GLUT-1-negative cases. GLUT-1, glucose transporter-1.