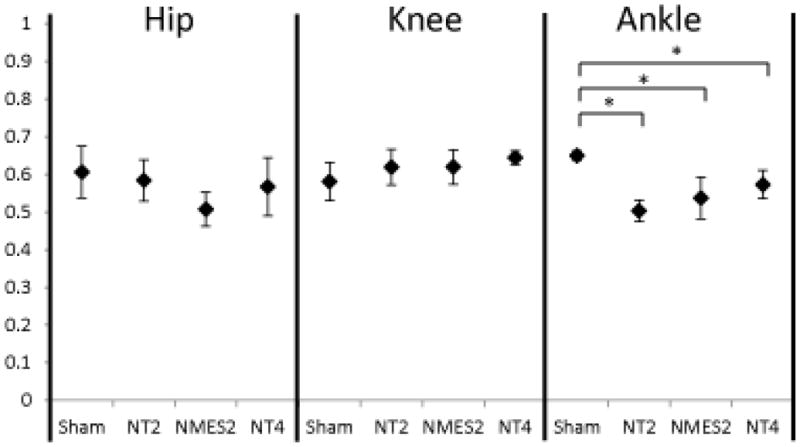
Figure 4.

Permutation entropy complexity measures. Sham and NT4 data derived from study described in,71 and new analysis based on data of NT2 and NMES2 data from.64 Permutation entropy quantifies the complexity of a time series signal, indicating how often it changes direction. Higher values indicate higher complexity. Following stimulation therapy, hip complexity decreased due to entrainment to the simple stimulation pattern. Following injury, ankle complexity decreased with a concomitant increase in knee complexity. Sham: sham injured rats, NT2 and NT4: iSCI rats with no training tested two weeks and four weeks post injury respectively, NMES2: iSCI rats with five days of electrical stimulation therapy tested two weeks post injury.
