Figure 2.
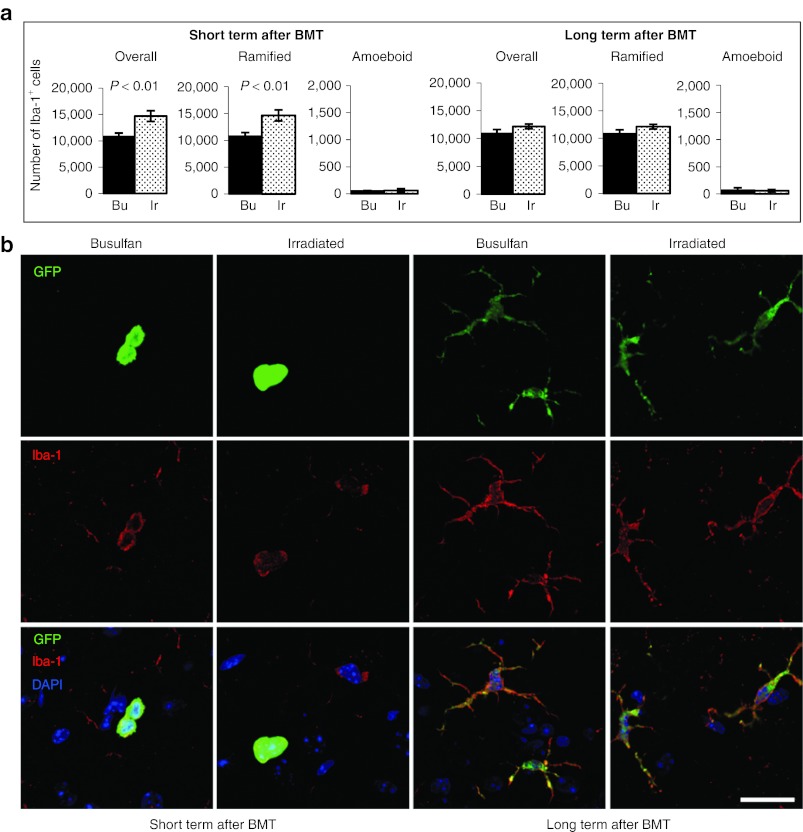
Quantification of total, resting, and activated Iba-1+ microglia in the brains of busulfan- and irradiation-conditioned transplant recipients. (a) The number of Iba-1+ cells were counted in the adjacent set of six brain sections, also according to their morphology, either ramified or amoeboid (n = 6/group). A significant difference in the overall number and number of ramified Iba-1+ cells was detected in the brains of irradiated (Ir) recipients in the short-term period after BMT (P < 0.01) compared with the busulfan-conditioned (Bu) recipients. No significant differences in Iba-1+ cells were detected in recipients long term after BMT. (b) Colocalization of GFP (green) and Iba-1 (red; nuclei, blue) in recipients in both the short and long term after BMT at high magnification (bar = 20 µm) visualized using confocal microscopy. Error bars represent the SEM and P values are from Student's t-test. BMT, bone marrow transplantation; GFP, green fluorescent protein.

