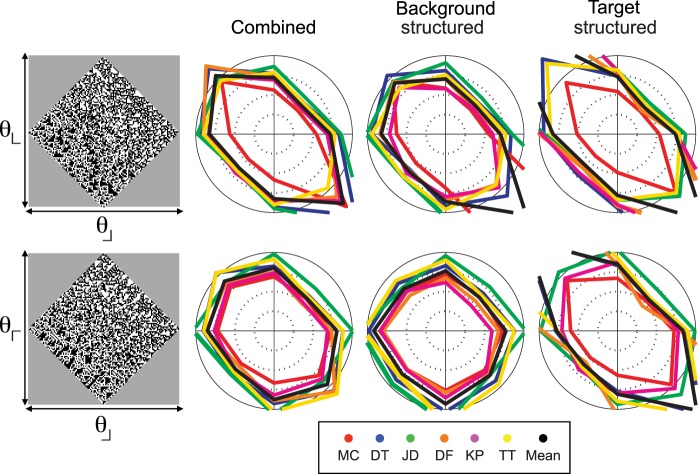
Figure 4.
Isodiscrimination contours for pairs of third-order statistics. As in Figure 3, the image at the left of each row shows the gamut of images for each pair of image statistics, and the polar plots are isodiscrimination contours, i.e., the location in the gamut at which criterion performance was reached. For other plotting conventions, see Figure 3. Note that for the pair (θ⌈, θ⌋), there is a strong dependence on whether the structured component of the stimulus was the background (near-circular contours, second column) versus the target (elongated contours, third column). N = 6.

