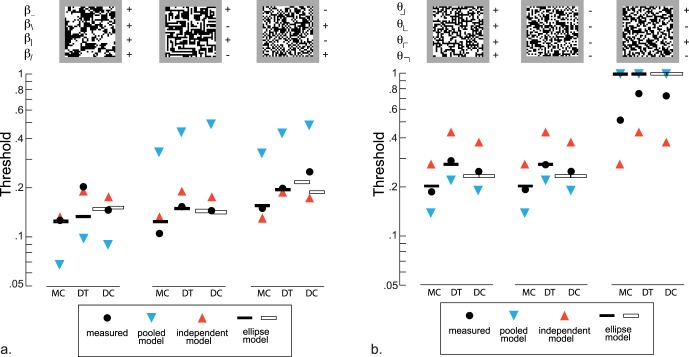
Figure 7.
Thresholds for four-component mixtures of second-order statistics (A) and third-order statistics (B), and comparison with model predictions. Measured thresholds (solid symbols) are shown for each kind of mixture; these are compared with predictions based on independent processing of each statistic (upward triangle), complete pooling (downward triangle) and the ellipse model (bars). Predicted thresholds exceeding 1 (which is outside of the gamut) are plotted at 1. Since subject DC did not participate in experiments in which thresholds for pairs of image statistics were measured, the interaction parameters were determined either from subject MC (left open bar) or DT (right open bar); see text for further details. Example images, shown above each set of measured thresholds, have 32 × 32 checks, and are constructed with all image statistics set to ±0.225.

