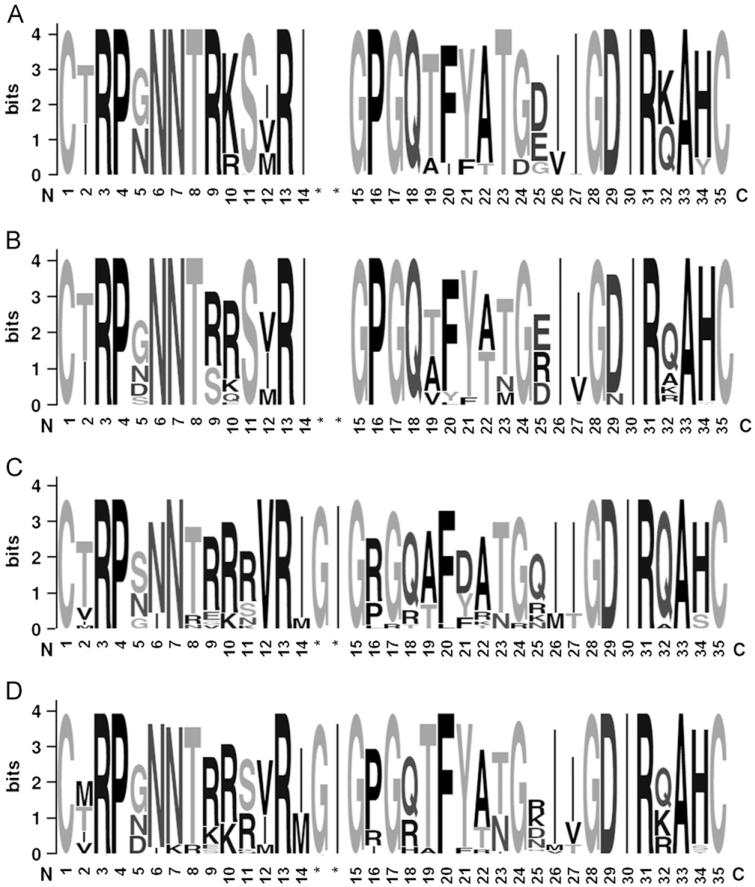
Fig. 3.
V3 loop sequences with the character and size of each logo representing the proportion of an amino acid at the specific site, and number based on position of alignment with HXB2. The variability at each amino acid position was calculated using the Shannon entropy score and schematically represented by the number of characters at each position, with a single character presenting 0 entropy score. R5 env sequences obtained from individuals infected with a population of exclusive R5 tropic (A) or DM (B) virus. Env sequences of X4 (C) and dual-tropic clones (B) isolated from individuals infected with a population of DM viruses. Asterisk (*) indicates position of amino acid insertions. (A) R5 from R5 quasispecies, (B) R5 from DM quasispecies, (C) X4 from DM quasispecies and (D) Dual-tropic from DM quasispecies.

