Fig. 4.
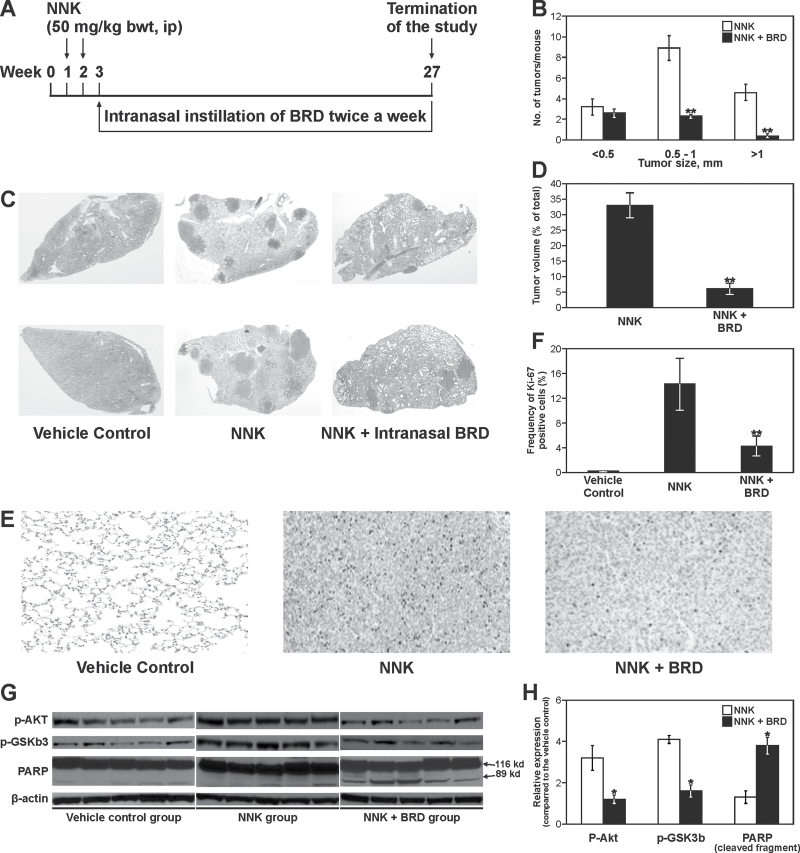
Effects of BRD on NNK-induced lung tumors in A/J mice. (A) Experimental design of lung tumor bioassay. (B) Effects of BRD on the growth of lung tumors. The size of surface tumors on lungs of mice was estimated using the calibrated scale in the eyepiece of a dissecting microscope. Each tumor was assigned to one of the following categories: <0.5, 0.5–1 and >1mm; **P < 0.001. (C) Images of representative cross-sections of lung tissues from control mice and mice treated with NNK alone, or NNK plus BRD (2mg per mouse). Lung tumors from NNK plus BRD-treated mice were fewer and smaller than tumors from mice treated with NNK alone. (D) Effects of BRD on the volume of NNK-induced lung tumors. Sections of lung tissues were stained with hematoxylin and eosin and the percentage of lung tissue occupied by the tumors was determined in three different cross-sections of the lungs of three mice per group using the Image Pro program; **P < 0.001. (E) Photomicrographs (×20) of Ki-67-stained lung tissues from mice treated with vehicle control, NNK or NNK plus BRD. Lung tissues were cut into 4-μm sections and stained with Ki-67 antibody and counterstained with hematoxylin. Images were captured with a camera attached to a Nikon Eclipse E800 microscope. (F) Quantitative assessment of Ki-67–positive cells, representing the percentage of cells that stained positive for Ki-67. The Ki-67 labeling index was calculated as described in Materials and methods. Columns: mean; bars: SD; **P < 0.001. (G) Western immunoblots of lung tissues. Lung tissue lysates prepared from whole normal lung tissues (vehicle control) or microdissected tumors from mice treated with NNK or NNK + BRD, five mice each, were loaded onto 4–12% sodium dodecyl sulfate–polyacrylamide gel electrophoresis and processed as described in Materials and methods. Equal loading of protein was confirmed by stripping the immunoblot and reprobing it for β-actin. (H) Quantitative data showing levels of pAkt, pGSK3b and cleaved PARP in NNK- and NNK + BRD-treated mice relative to the level in vehicle-treated mice. Protein band density was determined with a scanning densitometer (Personal Densitometer; Molecular Dynamics, Sunnyvale, CA). Data were generated from three independent experiments. *P < 0.05, compared with the NNK group.

