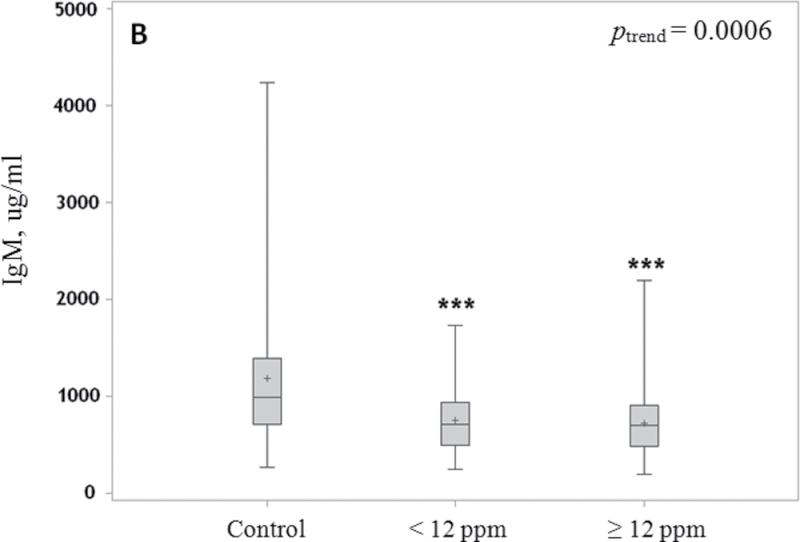
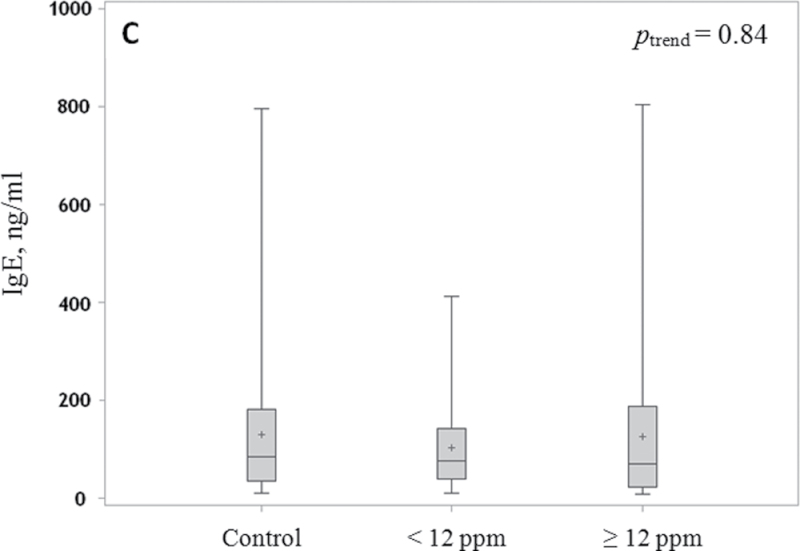
Fig. 1.
Box and whisker plot of serum levels of IgG, IgM and IgE. Median (line), mean (+) and interquartile range (box) and whiskers to the lowest and highest values in relation to TCE exposure level are shown for IgG (A), IgM (B) and IgE (C) in control subjects and workers exposed to <12 p.p.m. and ≥12 p.p.m. TCE. P-values are indicated as **P < 0.01 and ***P < 0.001. Levels of IgG and IgM were adjusted for age and sex, and levels of IgE were adjusted for age, sex, alcohol and recent infection.


