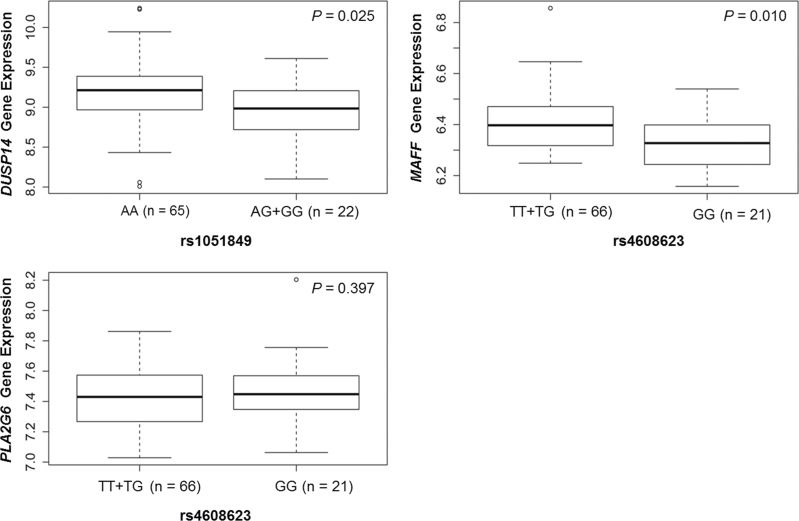
Fig. 2.
Analysis of DUSP14 and MAFF expression levels by genotypes of rs1051849 and rs4608623 in 90 HapMap lymphoblastoid cell lines from Caucasians (three with missing data). Consistent with their association results in Table III, genotypes AG + GG of rs1051849 were associated with low mRNA expression levels of DUSP14, compared with that of the AA genotype (P = 0.025); for SNP rs4608623, GG genotype carriers had lower MAFF expression levels than those with TT + TG genotypes (P = 0.010). The y-axis is the normalized gene expression levels. The box represents the central 50% of the data or the interquartile range. The lower edge of the box plot is the first quartile or 25th percentile. The upper edge of the box plot is the third quartile or 75th percentile. The line in the box is the median value. The ends of the vertical lines extend to minimum and maximum unless these values exceed 1.5 × interquartile range.

