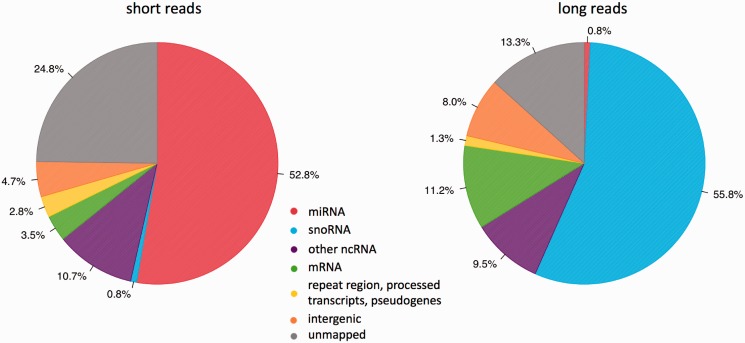
Figure 1.
Genome annotation of sequencing reads from 10 mouse tissues. The pie charts depicted the percentage of 10–40 nt short reads (A) and 50–100 nt long reads (B) that were mapped to the indicated genome features based on miRBase v16.0 (34) and Ensembl Genes 59 (www.biomart.org) (37). ‘Other ncRNA’ included rRNA, tRNA, scRNA, snRNA and srpRNA.

