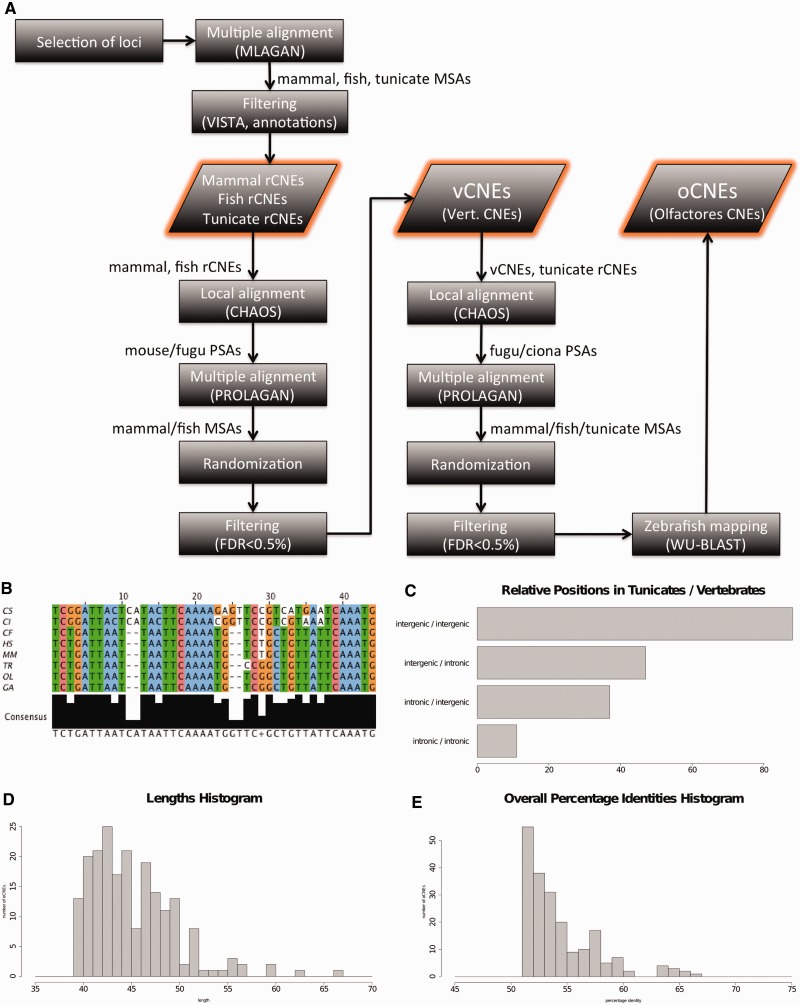
Figure 1.
Description of oCNEs workflow and data: Panel A shows the schema representing the workflow of the pipeline herein presented. In the boxes are indicated the different steps of the procedure, out of the boxes the input and/or output of each step. MSA: multiple sequences alignment. PSA: pairwise sequences alignment. In B is shown an example of the conserved element (oCNE) discovered. Panel C indicates the number of oCNEs classified accordingly to their genomic locations relatively to the associated gene structure in tunicates and vertebrates. The majority of elements are conserved in intergenic regions in both organism groups. Finally, D and E plot the distributions of the length and of the overall percentage identity of the 183 oCNEs.

