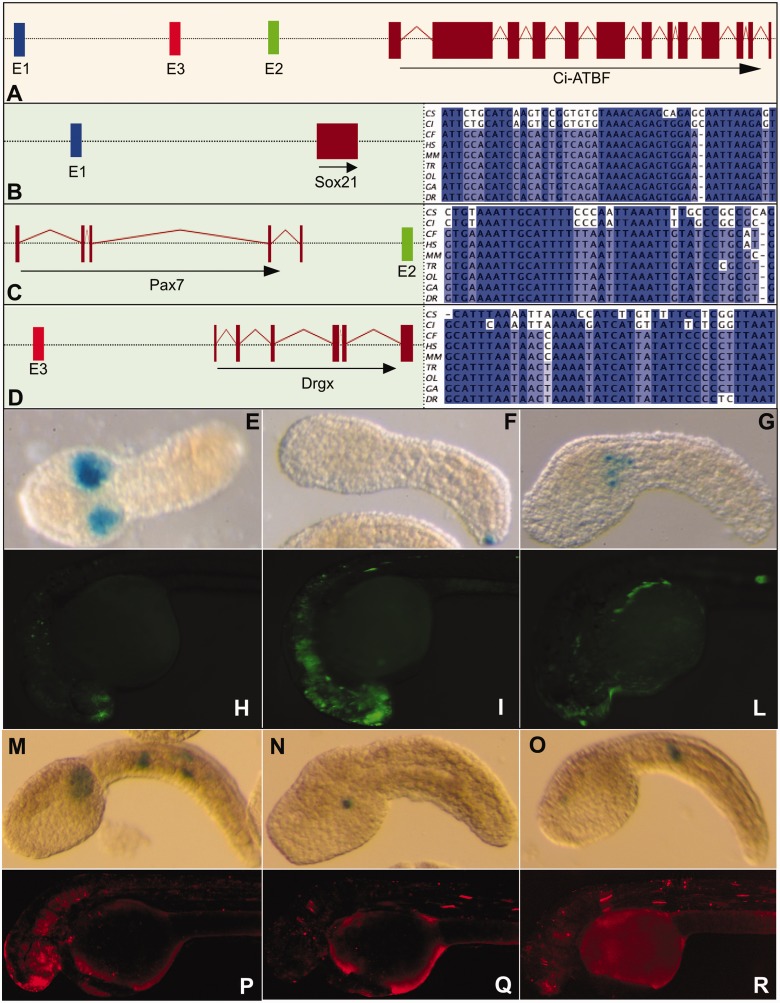
Figure 2.
Functional validation of oCNEs enhancer function: three oCNEs were selected to be validated (E1, E2 and E3). Schemas represent the genomic intervals containing the selected oCNEs and the reciprocal positions of the elements and the associated genes. For clarity purposes the schemas are not respecting a specific scale. Panel A indicates that the three chosen elements are present in the same intergenic region in tunicates associated to the Ci-ATBF gene. In B–D are reported the three distinct vertebrate intervals containing the selected conserved sequences E1, E2, E3 and the respective oCNE alignments in all the analyzed species. Pictures E–G report the most representative expression pattern driven by the elements E1, E2 and E3, respectively, in C. intestinalis. Pictures H, I, L report the most representative expression pattern driven by the elements E1, E2 and E3, respectively, in D. rerio. M–O report the most representative expression pattern driven by the zebrafish elements E1, E2 and E3, respectively, injected in C. intestinalis. Finally P–R report the most representative expression pattern driven by the Ciona elements E1, E2 and E3, respectively, injected in zebrafish embryos.

