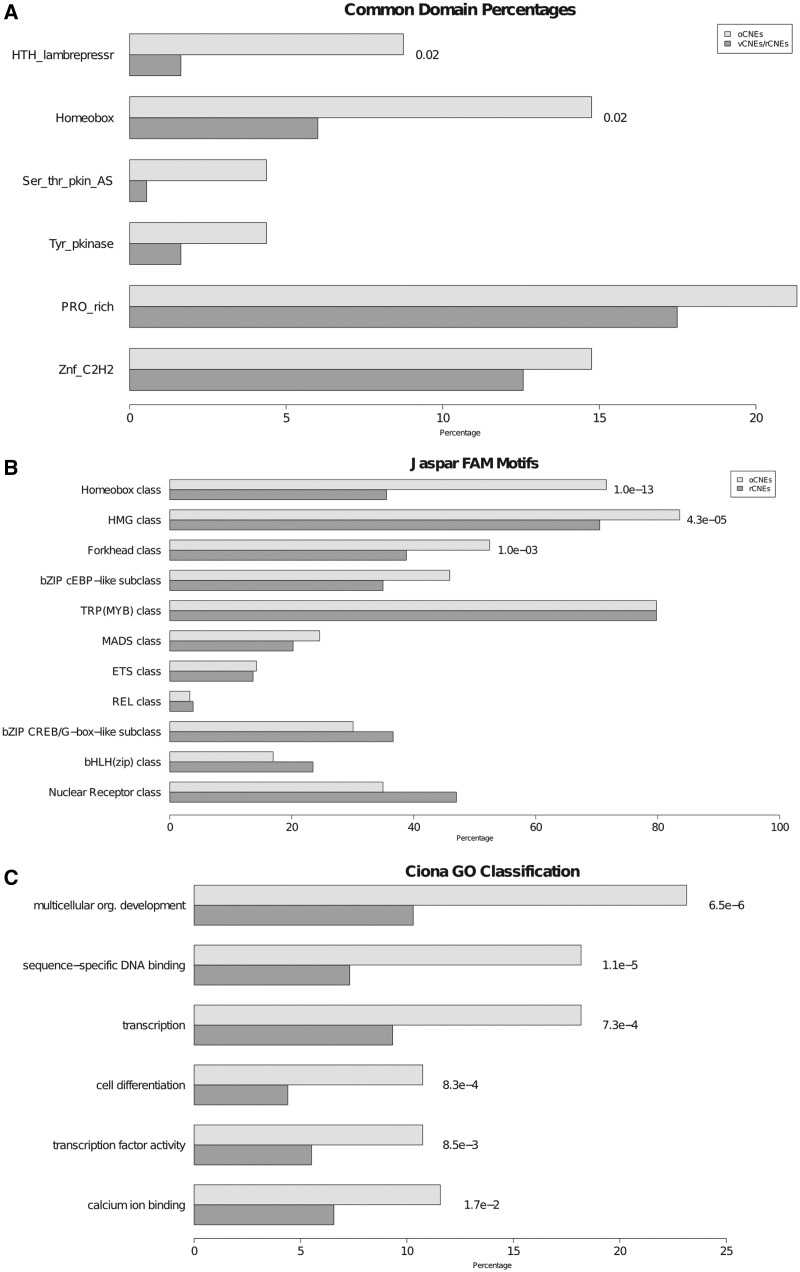
Figure 4.
Functional enrichment analyses: A shows, for each domain, the percentage of oCNEs (light grey) and vCNEs/rCNEs random couples (dark grey) falling in intergenic regions associated to genes containing the same specific domain in all the species analyzed. Only domains for which the percentage is higher in oCNEs are reported. Adjusted P-values of the differences between the two groups are reported only if significant. Panel B shows, for each Jaspar fam motif, the percentage of C. intestinalis oCNEs (light grey) and C. intestinalis rCNEs (dark grey) containing at least one binding site for the specific motif. Adjusted P-values of the differences between the two groups are reported only if significant. C shows GO enrichments for each GO class associated to genes flanking tunicate oCNEs (light grey) and tunicate rCNEs (dark grey). Only oCNEs-associated significantly enriched classes are reported with the respective adjusted P-values.

