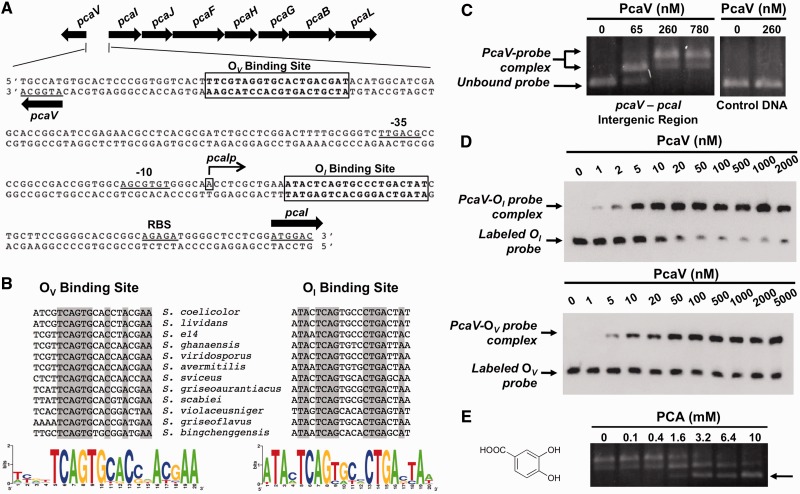
Figure 1.
PcaV recognizes two operator sites in the pcaV–pcaI intergenic region. (A) The organization of the pca operon in S. coelicolor is depicted with the gene names above the arrows. The pcaV–pcaI intergenic sequence shows the PcaV operator sites (boxed), the transcriptional start site of pcaI (denoted as pcaIp), putative -35 and -10 pcaI promoter elements and a putative ribosome binding site (RBS). (B) Full sequence alignment of PcaV operator sites identified in the Streptomyces genus through the Gibbs Motif Sampler. Conserved nucleotides are highlighted in gray. Sequence logo images depict the sequence conservation of PcaV operator sites. (C) Agarose EMSA experiments using a PCR-amplified DNA probe spanning the pcaV–pcaI intergenic region and increasing concentrations of PcaV. In comparison with the unbound DNA probe in the electrophoresis, retarded migration of the DNA probe was observed on addition of PcaV. The formation of the PcaV–probe complex is indicated by a double arrow, whereas the unbound DNA is indicated with a single arrow. The control DNA probe spans a region of the pcaH open reading frame and does not contain PcaV operator sites. (D) Representative quantitative EMSA experiments using PCR-amplified biotin-labeled probes containing the OI site (top) or OV site (bottom) and increasing concentrations of PcaV. A single shifted band corresponding to the PcaV–probe complex is observed. Experiments were performed in triplicate to calculate dissociation constants (Kd). (E) Agarose EMSA experiments using PcaV bound to the pcaV–pcaI intergenic probe and increasing concentrations of protocatechuate. The dissociation of PcaV from the DNA is observed on addition of increasing amounts of protocatechuate. The unbound DNA is indicated with a single arrow. The structure of the PCA ligand is shown on the left.

