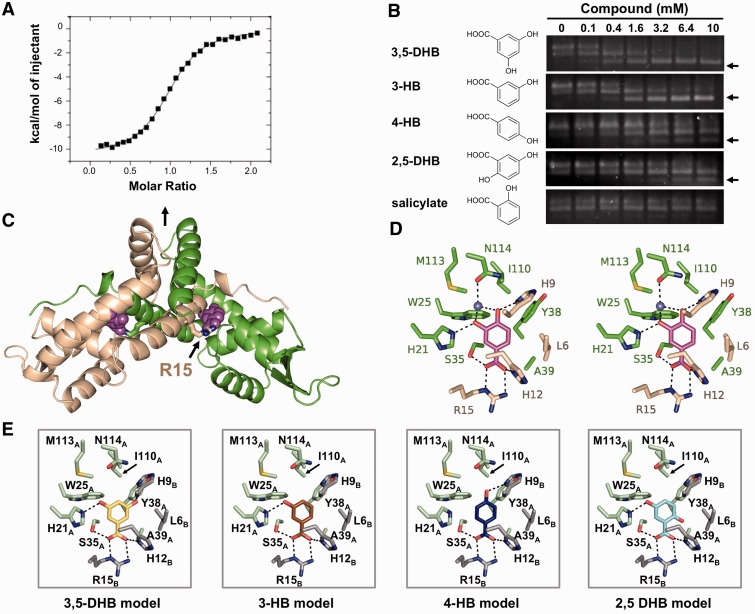
Figure 2.
The structure of PcaV bound to its ligand protocatechuate. (A) Representative binding isotherm of PCA titrated into WT PcaV. Raw data are shown in Supplementary Figure S2A. (B) EMSAs of PcaV–DNA complex in the presence of increasing amounts of the indicated ligands. Unbound DNA is indicated with an arrow. (C) The crystal structure of the PcaV–PCA complex. The PcaV dimer is shown as a ribbon representation, with one monomer in green and the second monomer in beige. The two-fold dimer interface is denoted with a vertical black arrow. The bound PCA ligands (magenta spheres) bind in symmetrical pockets buried between helices α1, α2 and α5 from one monomer and helix α1 from the second monomer; Arg15 is shown in stick representation. (D) Stereo image of the protocatechuate (colored in magenta) binding pocket; residues from both PcaV monomers are shown as sticks (colored as in C). Polar contacts are shown as dashed lines; the light blue sphere is a water molecule. (E) Models of the putative PcaV–ligand interactions from (B). Each model was generated through superposition onto the PCA molecule in the PcaV–PCA crystal structure. Potential polar interactions are shown as dashed lines.

