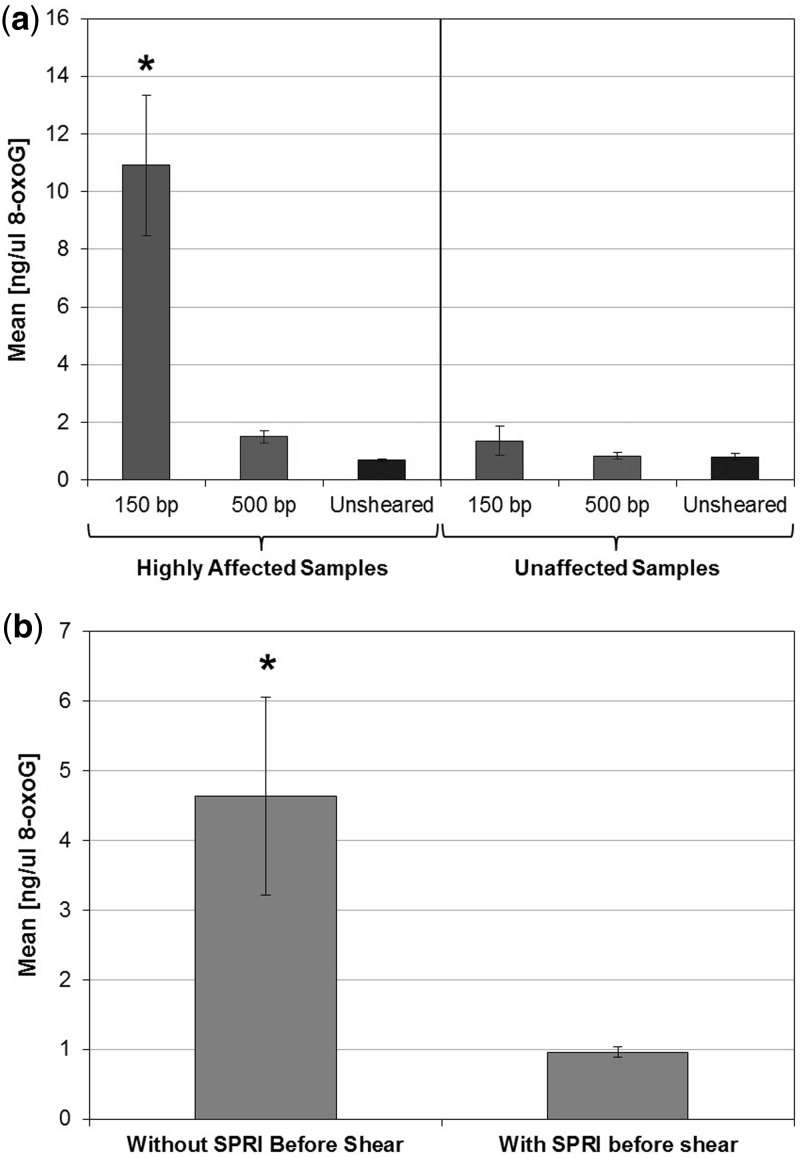
Figure 7.
8-oxoG ELISA results. (a) Bar chart of mean ng/ml of 8-oxoG for affected and unaffected samples processed with different shearing conditions. The ‘Highly Affected’ samples with high artifact rate sheared to 150 bp had a significantly higher level of 8-oxoG post shearing as compared with all other samples and conditions (asterisk denotes P < 0.01). (b) Bar chart of mean ng/ml of 8-oxoG, showing the significant decrease in 8-oxoG levels post shearing for samples following buffer exchange (asterisk denotes P < 0.05).

