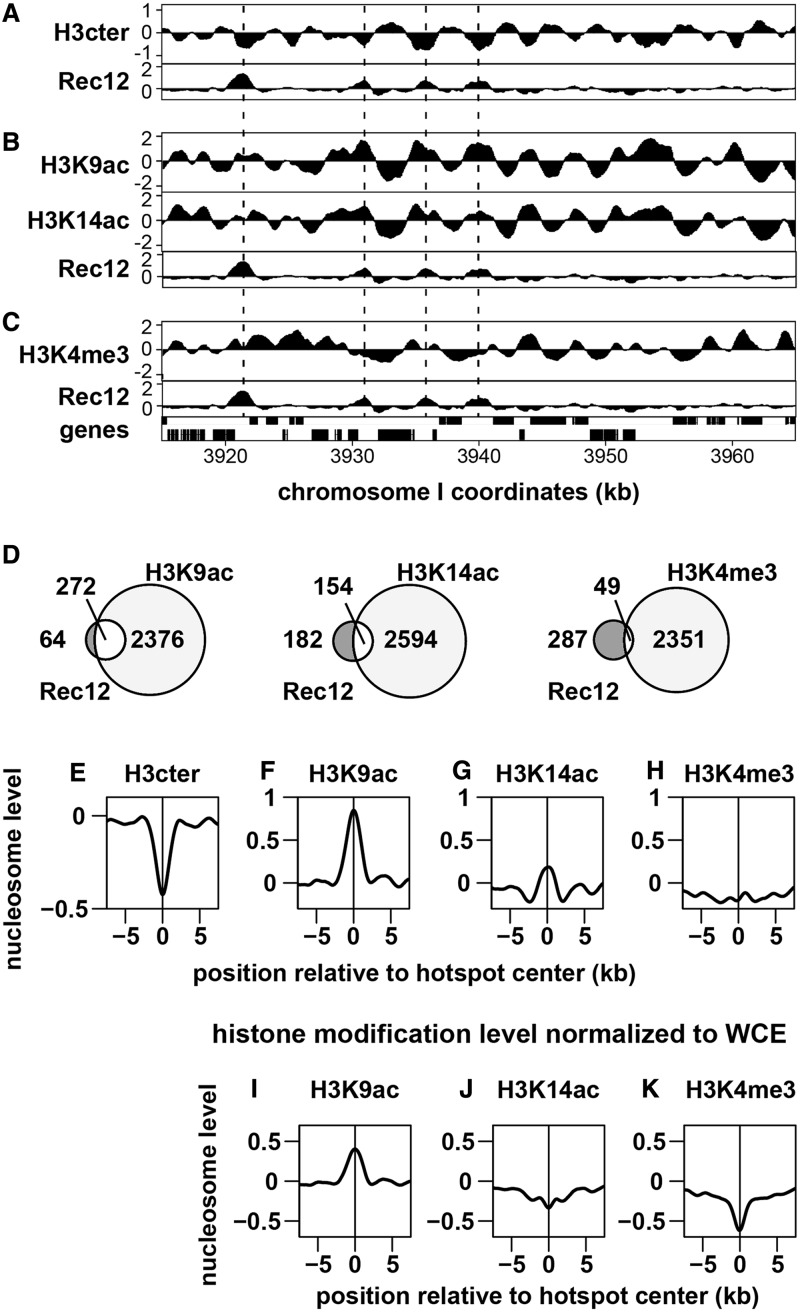
Figure 4.
Genome-wide analysis of histone modifications around meiotic recombination hotspots. The pat1-114 cells were induced into meiosis and harvested as in Figure 1. ChIP was performed using anti-histone H3, H3K9ac, H3K14ac and H3K4me3 antibodies, and the resultant DNA was analysed by GeneChip® S. pombe Tiling 1.0FR Array. The pat1-114 rad50S rec12+-FLAG cells were induced into meiosis and harvested 5 h after the induction. ChIP was performed using anti-FLAG antibody, and the resultant DNA was similarly analysed. (A–C) Examples of ChIP-chip data. The x-axis shows the chromosomal coordinates in bp, and the y-axis shows the log2 of signal strength. The vertical dotted lines indicate Rec12 binding (i.e. DSB) sites. Genes are shown as filled boxes at the bottom of the figure. Comparison between Rec12 binding sites (Rec12) and histone H3 (H3cter; A), acetylated histone H3 (H3K9ac and H3K14ac; B) or trimetylated histone H3K4 (H3K4me3; C). Representative results are shown. Note that the levels of modified histones (B and C) are normalized to those of histone H3. (D) Venn diagrams showing the overlap between Rec12 binding (DSB) sites and modified histones calculated as described in ‘Materials and Methods’ section. (E–K) Distribution of histone H3 (E), H3K9ac (F and I), H3K14ac (G and J) and H3K4me3 (H and K) around meiotic recombination hotspots. The charts were created by a moving average method with a window size of 1 kb and a step size of 0.1 kb. The y axis shows the log2 of signal strength. The lines indicate the average of all hotspots. (F–H) Histone modification levels normalized to histone H3 were presented. (I–K) Histone modification levels normalized to whole-cell extract were presented.

