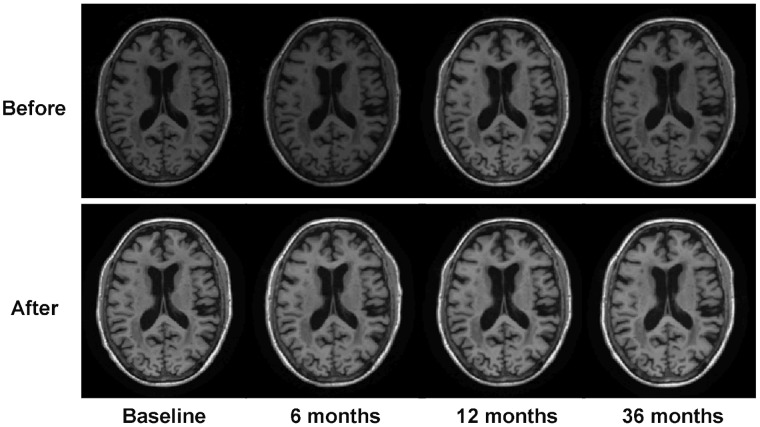
Figure 3. Illustration of N3 correction and histogram matching on serial images of one subject at 4 time points.
Axial slices of the serial images before and after the processing are shown, respectively. We can see that the intensity inhomogeneity and inconsistency of the serial images are removed clearly.

