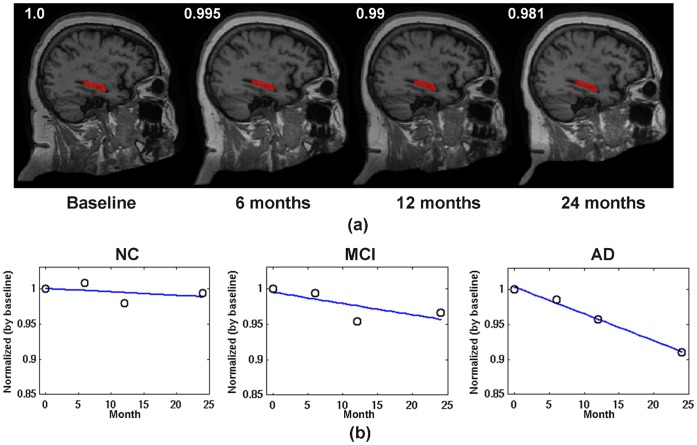
Figure 11. Brain labeling results.
(a) Automated 4D labeling results of hippocampus (in red) for a typical normal control subject, with four example slices provided. The hippocampal volume, which was normalized by baseline, decreases slightly from 1 (baseline) to 0.995 (6 months), 0.99 (12 months), and 0.981 (24 months). (b) The temporal development trends of hippocampal GM volume (also normalized by baseline) for the NC, MCI, and AD groups, respectively. The blue line in each plot is a linear fitting for the mean hippocampal GM measured at different time-points.

