
Figure 2.
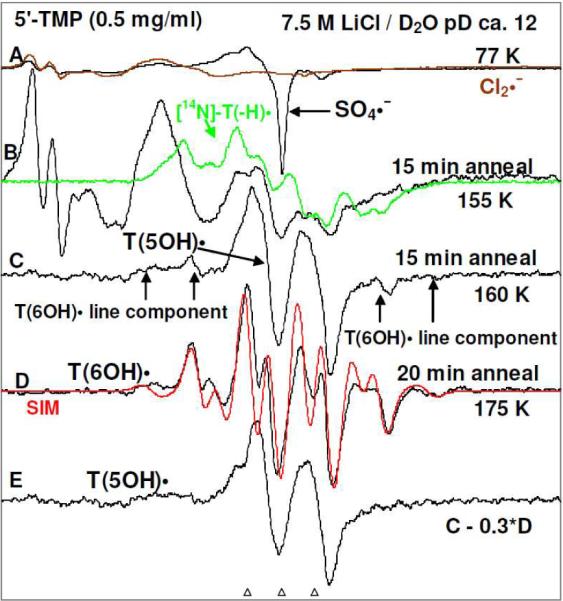
ESR spectra of (A) γ-irradiated glassy sample of 5'-TMP (0.5 mg/ml in 7.5 M LiCl/D2O) in the presence of electron scavenger K2S2O8 at pH ca. 12 (black); partial spectrum (brown, 220 G scan) of a pure Cl2•− spectrum is overlapped on the black spectrum in A to show the Cl2•− line components in the black spectrum. (B–D) Spectra (black) found after annealing to (B) 155 K for 15 min, (C) 160 K for 15 min, (D) 175 K for 20 min. The spectrum of T(−H)• (green, Figure 1A) is overlapped on spectrum (B). The red spectrum in (D) is the simulated spectrum of T(6OH)• which is a mixture of T(6OH)• with β C6-H HFCC of 9 G (80%) and with β C6-H HFCC of 45 G (20%). See text and supporting information Figure S2 for details of simulation. (E) The black spectrum, assigned to T(5OH)•, is obtained by 30% subtraction of spectrum (D) from spectrum (C). All spectra are recorded at 77 K.