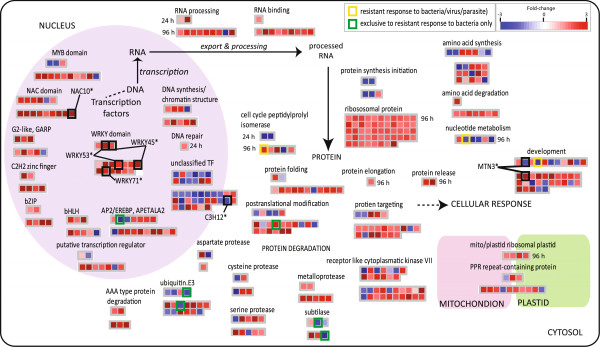
Figure 5.

Custom Mapman visualisation of DNA to protein targeting functions following Xoo infection. A false coloured heatmap showing the fold-change response following Xoo. infection is shown, where each coloured square represents the fold change for a single gene. Fold-changes following 24 HPI is shown above those at 96 HPI. Yellow squares indicates universal stress markers, as these genes were seen to be up-regulated following bacterial infection (this study), following parasite, fungal and viral infection [13,14], as well as following heat, cold, drought and salt stress [17,18].
