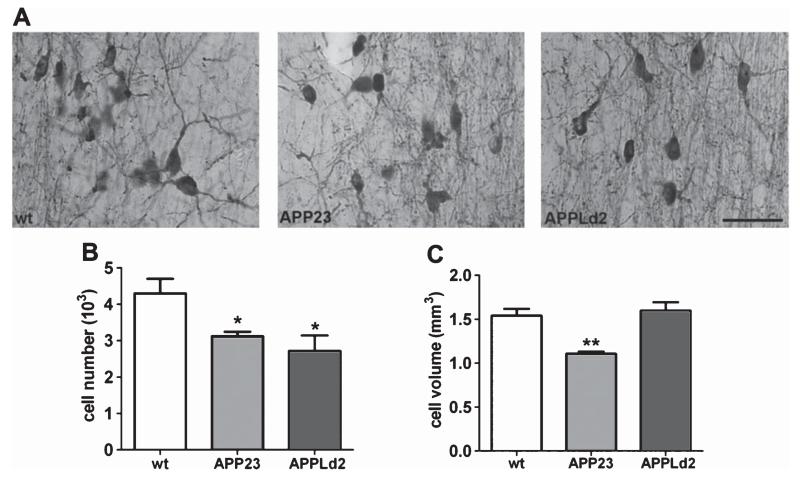
Fig. 4.
Cholinergic neuron degeneration in the MSN of APP23 and APPLd2 mice. A) ChAT-immuno-positive neurons in the MSN of APP23 (middle panel, n = 7) and APPLd2 (right panel, n = 8) show fiber deafferentation and retracted neurites compared to age-matched wt controls (left panel, n = 6). Unbiased stereological quantitation of ChAT-immuno-positive cell number (B) and cell-soma volume (C) are depicted (cell number ± SEM; mean volume ± SEM) (wt, n = 6; APP23, n = 7; APPLd2, n = 8). Scale bar, 50 μm. Differences from wt were significant at *p < 0.05; **p < 0.01.

