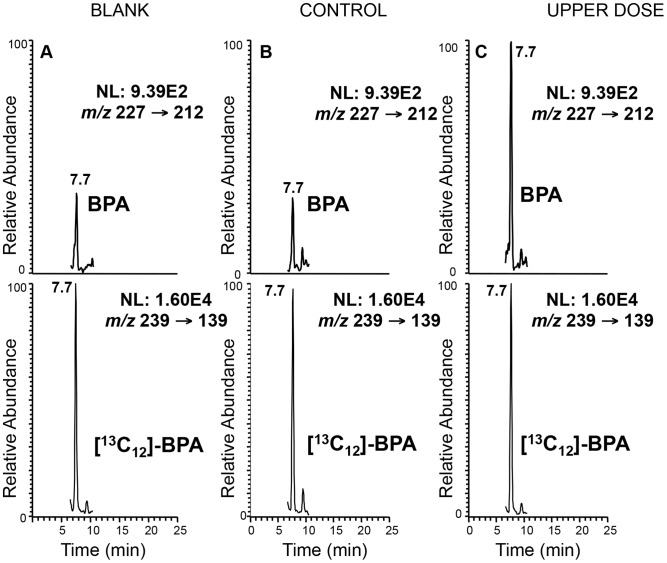
Figure 1. Representative LC-SRM/MS chromatograms demonstrating significantly higher BPA level in serum from treated mice.
Top panels represent the chromatograms for unlabeled BPA and lower panels labeled BPA ([13C12]-BPA) spiked prior to sample extraction to quantify BPA levels in serum from representative control (B) and upper dose treated mice (C). Blank sample used as control for storage and extraction is indicated in (A). Y-axis represents relative abundance of signal intensity and X-axis retention time in minute. Differences in BPA concentrations were determined based on peak heights (see Materials and Methods). NL = normalized levels of intensity; m/z = mass to charge ratio.

