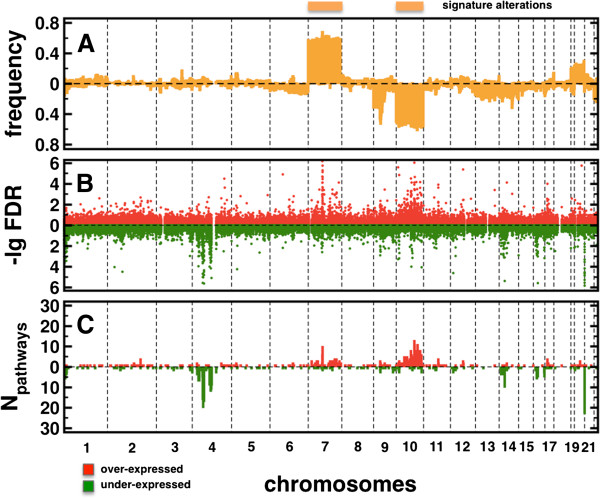
Figure 2.

Statistics of associations. (A) The profile of genomic alterations in glioblastomas allowed us to observe large areas of genomic amplifications on chromosome 7 and deletions on chromosome 10. (B) Considering their significance, we found that associations to over-expressed pathways largely coincided with signature alterations. In turn, strong associations to under-expressed pathways mostly appeared on chromosome 4. (C) Such observations were emphasized by the number of different pathways that tag-loci were associated with if the FDR of an association was < 0.05.
