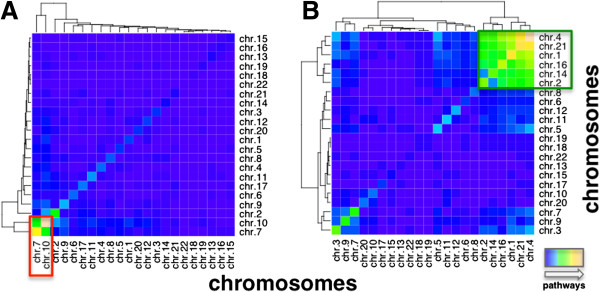
Figure 3.

Chromosomal analysis of significant associations. In (A) we counted the number of different, over-expressed pathways that were significantly associated with tag loci on given chromosomes in GBMs. Clusters in the heatmap suggested that chromosomes 7 and 10 largely shared most pathways (red box). (B) Analogously, we determined such overlaps of under-expressed pathways, indicating a more scattered result. Chromosomes 1, 2, 4, 14, 16 and 21 appeared to strongly share pathways (green box).
