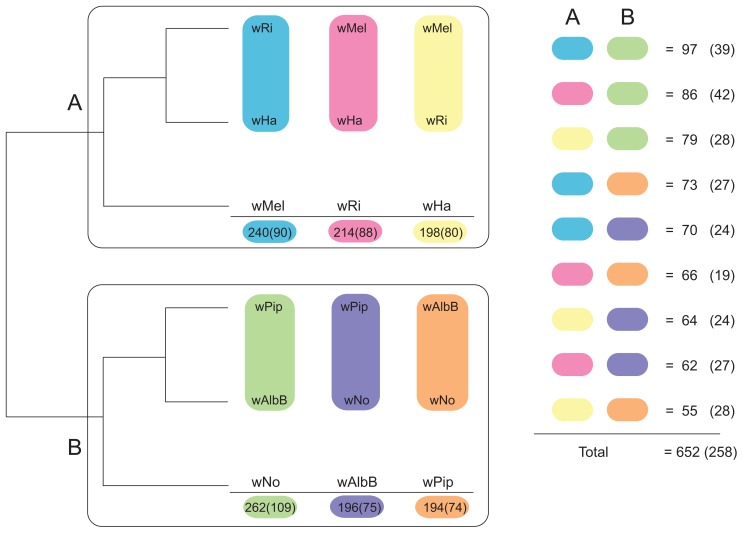
Figure 3. Schematic figure of individual tree topologies inferred from single-copy orthologs.
Phylogenetic trees were inferred using the maximum likelihood methods from 660 single-copy gene orthologs, 652 of which supported the division between super-group A and B. The schematic tree summarizes the distribution of the 652 gene trees, where the number of trees supporting a topology within each super-group is shown. The coloured blocks on the right show the number of trees found for each of the 9 possible topologies with separation of the supergroups. The numbers were obtained by clustering individual trees based on weighted Robinson-Fould distances. Numbers in parenthesis represent the trees where all nodes have a bootstrap value higher than 75.

