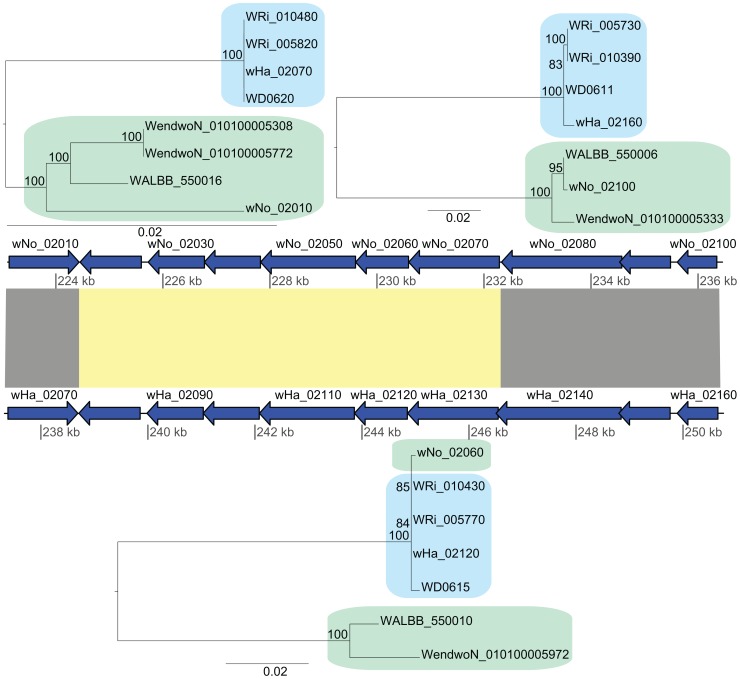
Figure 4. Recombination of chromosomal genes between the supergroup A and B strains.
The yellow block indicates the six genes that produce a gene topology indicative of recombination between wNo and the A-group strains (tree topology shown below the gene order comparison plot). The upstream and downstream flanking genes show the normal separation of the strains into two super-groups (tree topologies shown above the gene order comparison plot).

