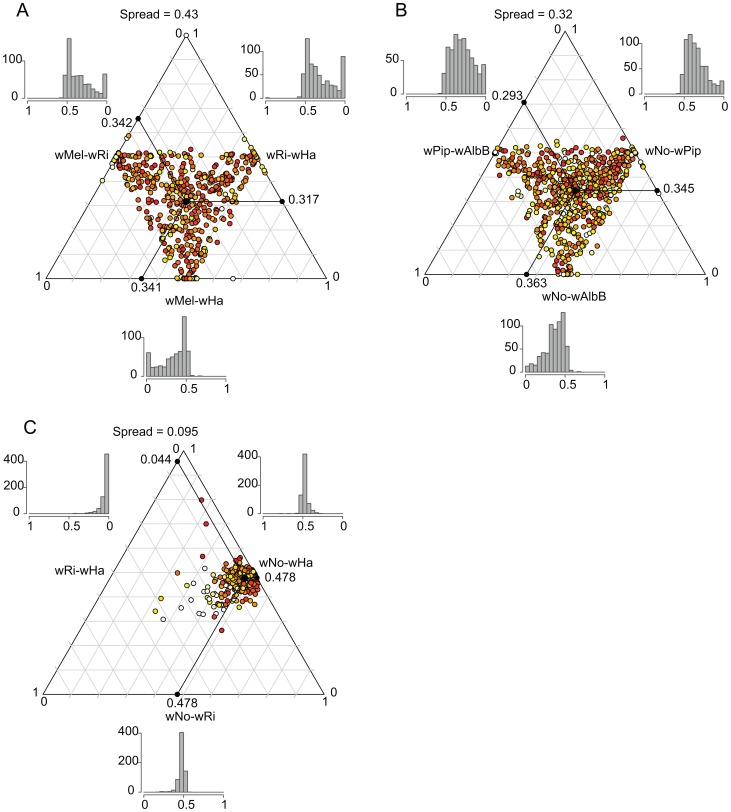
Figure 6. Ternary plot of sequence divergence levels at synonymous sites.
The plot shows the variation in synonymous substitution frequencies for the 660 single-copy orthologs in A) supergroup A Wolbachia strains, B) supergroup B Wolbachia strains and C) D. simulans infecting Wolbachia strains. Each dot in the plot represents one gene. Absolute dS-values have been transformed to relative values between 0 and 1 and the mean relative dS-value for each pair is shown on each axis. The spread represents the median distance to the mean point. The color of each dot represents the maximum absolute dS-value among the 3 pairs, ranging from light yellow (low values) to red (high values). The histograms show the frequency of relative dS-values within each pair.

