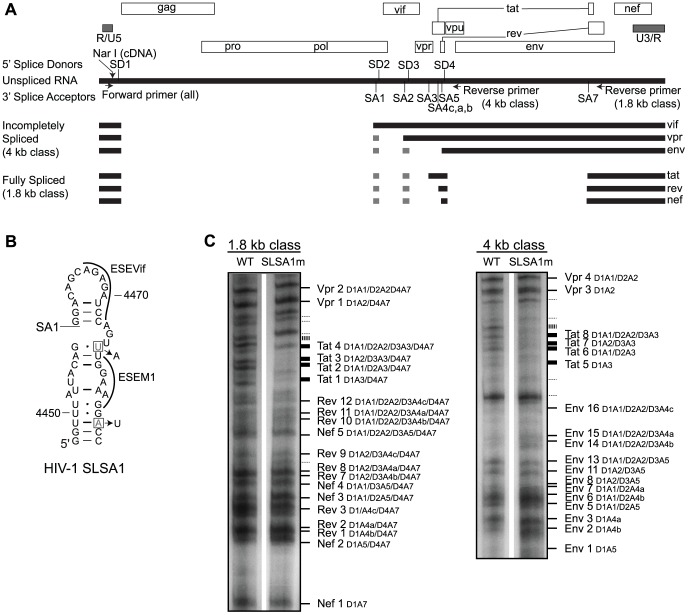
Figure 8. Profiles of HIV-1wt and HIV-1SLSA1m transcripts.
(A) Diagram displaying reading frames (open boxes) of the HIV-1NL4-3 genome. Solid lines indicate different classes of mRNA including unspliced, 4 kb, and 1.8 kb, with their corresponding genes labeled on the right. Gray boxes represent exons 2 (between SA1 to SD2) and 3 (between SA2 and SD3). Splice donors (SD1-4) and acceptors (SA1-7) are labeled on the top of the unspliced length of RNA The sites of NarI cleavage and primer-binding for the forward and reverse primers used to create the splicing profile are shown on the unspliced RNA. (B) SHAPE-derived structure for the SLSA1 hairpin in HIV-1NL4-3. The first splice acceptor (SA1) is labeled. The mutated nucleotides in HIVSLSA1m are boxed, and the mutations are identified next to the arrows. Exonic splicing enhancer sequences (ESEVif and ESEM1) [52], [71] are labeled. (C) Splicing profiles for HIV-1wt and HIV-1SLSA1m grown for three days in CEMx174 cells are shown. The cDNA from the 1.8 kb class (left) or the 4 kb class (right) of transcripts, amplified with the corresponding primers, was separated on a 6% polyacrylamide gel and labeled according to common nomenclature [10] (solid lines) or left unidentified (dotted lines). Decreased band intensity between the WT and SLSA1m transcripts is marked by thicker lines.

