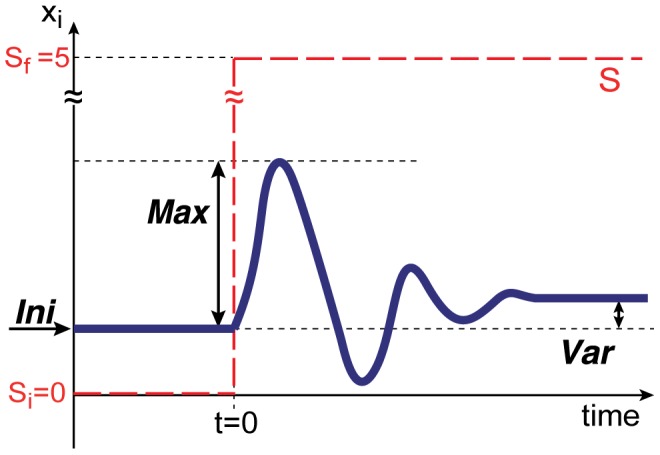
Figure 2. Definition of our evaluation function.

Three elements,  ,
,  , and
, and  , were defined as shown. The input (
 ) is shown by the broken red line, and the output is shown by the solid blue line.
  was defined as an average value over some duration.

Three elements,  ,
,  , and
, and  , were defined as shown. The input (
 ) is shown by the broken red line, and the output is shown by the solid blue line.
  was defined as an average value over some duration.