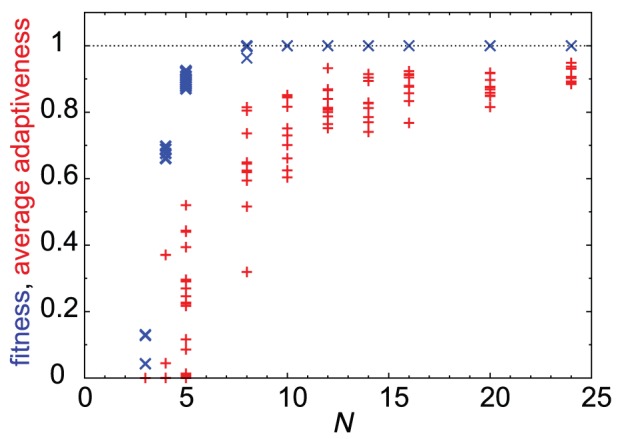
Figure 5. Cooperative adaptive responses can evolve only in a system with many degrees of freedom.

Changes in fitness (blue  ) and average adaptiveness (red
  ) (ordinate) according to
  (abscissa). For
  , we searched all networks and identified those with high fitness; fitness
 for
for  , fitness
 for
for  , and fitness
 for
for  . While, for
  , the values for the network with the largest fitness at the
  th generation are shown for
  different strains for each
  .
.  was set to satisfy
  for
for  .
.
