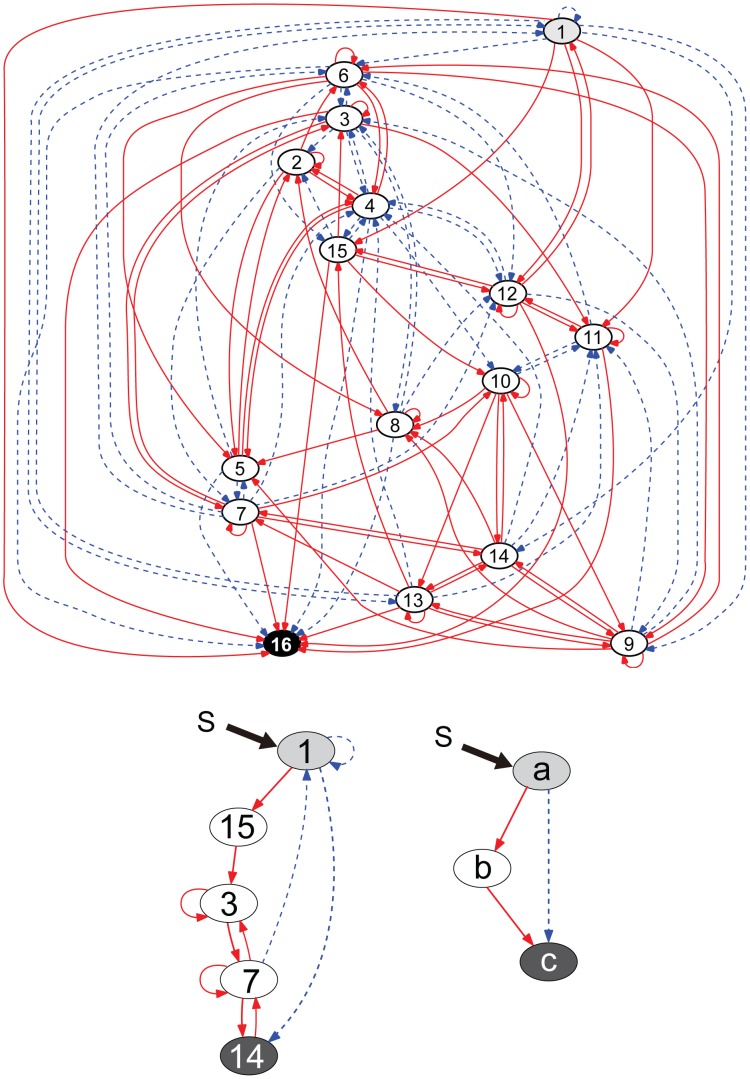
Figure 7. Network structure of a cooperative adaptive network.
(upper) An example of cooperative adaptive networks with  which does not include the minimal adaptive motifs of 3 genes at any part of the gene regulatory network, but shows adaptive behaviors for all genes (except the input gene). The input (
 ) acts on the input gene (
 ) and the target gene is
  . Interactions between genes are shown by arrows; arrows with solid red lines show activation, whereas arrows with broken blue lines show suppression. (lower left panel) An example of a substructure showing a similar role with the minimal adaptive motifs extracted from the upper network. For reference, a related adaptive motif with 3 genes (
 in Figure 6) was redrawn (lower right panel).

