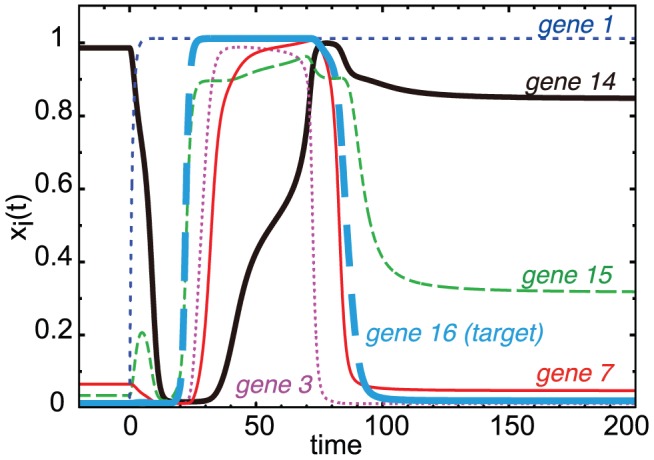
Figure 9. Expression dynamics in cooperative adaptive networks.

Responses of some genes that form the substructure shown in Figure 7 (lower left) extracted from the network shown in Figure 7 (top). The time series of  for
for  and
and  (target gene) is plotted with different colors, after
  is changed from
  to
to  at time
  . The response of? the receiver (
 ) is shown with a solid black bold line. Here, the target gene (
 , solid cyan broken line) shows perfect adaptation with a plateau at
  for times between
  and
and  .
.
