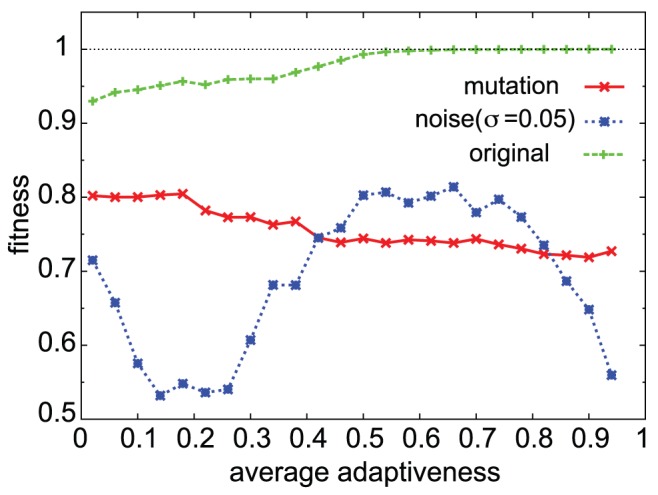
Figure 11. Robustness of cooperative adaptive networks.

Changes in the fitness value (ordinate) under mutations (red  ) or noise (blue
  ), for evolved networks with different average adaptiveness (abscissa). We first evolved networks with
  ,
,  , and
, and  , and then sampled those networks with fitness values
  . We repeated
  different runs of evolutions to sample such fitted networks, and collected a total of 20,038 networks. We then made a histogram of average adaptiveness values with a bin size of 0.04. For networks in each bin, we removed a single path directly connecting any 2 genes. We computed the fitness values for such emulated networks over all possible removals of single paths. After averaging all networks in the average adaptiveness of a given bin, the average fitness value by mutation was obtained. Also, instead of mutations, we added a noise term in the model as mentioned in the text, with the noise amplitude
  , and computed the fitness. Again, by averaging over the networks in a given bin of average adaptiveness, the fitness under noise is obtained. The original fitness values are shown with green
  symbols.
