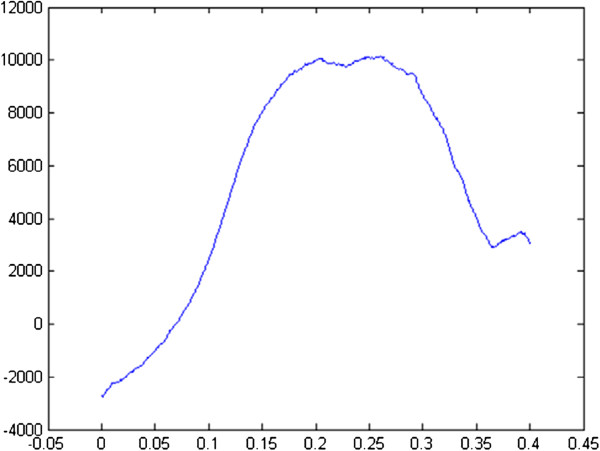
Figure 2.
Representative pressure (Pa) - stretch curve for all the samples obtained from the traction test until failure. The resulting curve is composed of a non-linear toe region (stretch between 0 and 0.1), a linear region (stretch between 0.1 and 0.15), a plastic region (stretch between 0.15 and 0.3) and a failure region (stretch over 0.3). The Young’s modulus E is the slope of the curve in the linear part.

