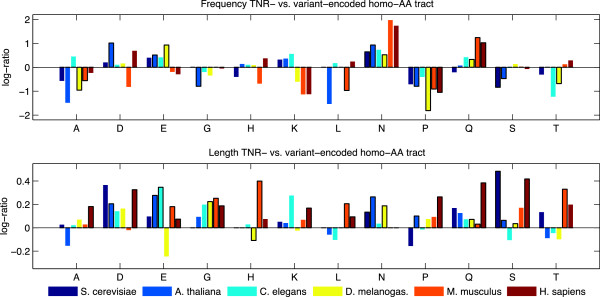
Figure 3.

TNR- vs. variant-encoded amino acid repeats in multiple organisms. Top: The log-ratio of the proportion of amino acid repeats for TNR- vs. variant-encoded tracts. Bottom: The log-ratio of the length of amino acid repeats for TNR- vs. variant-encoded tracts. Significant (p<0.05) differences are identified by bars with a black outline.
