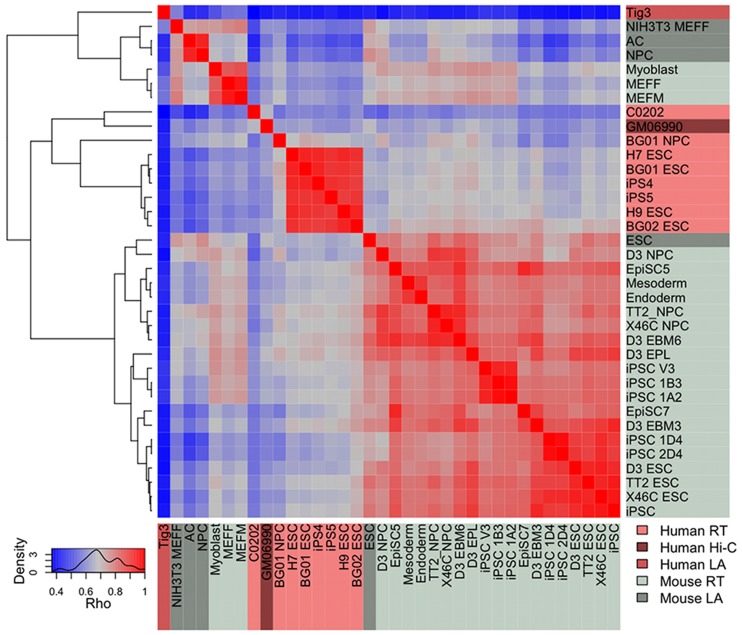
Figure 1. Global correlation matrix of higher order chromatin datasets.
The heatmap and dendrogram show the relationships among 36 chromatin structure datasets (Spearman's rho: 0.38 to 0.98, p<1e-16). Datasets are labelled according to the experimental platform of origin: light grey = mouse RT, light pink = human RT, dark grey = mouse LA, medium pink = human LA, dark pink = human Hi-C.

