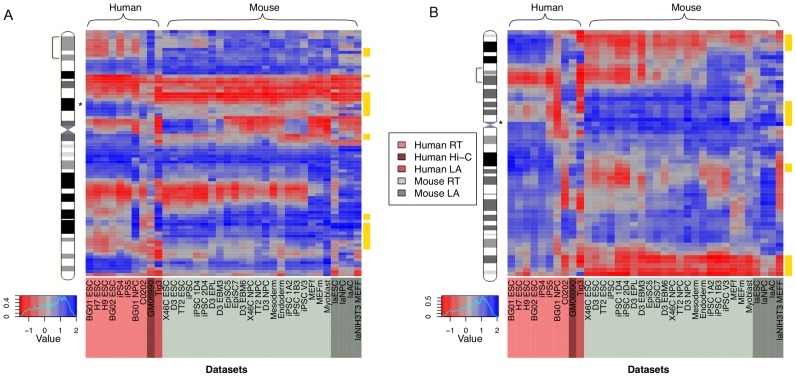
Figure 2. Specific human and mouse regions show significant divergence in higher-order chromatin structure.
Human (pink) and mouse (grey) higher order chromatin structure across all cell types assayed, shown for two regions of the human genome: chromosome 11p15.2–15.4 (1.2–15 Mb) with the location of an OR gene cluster indicated by an asterisk (A); chromosome 7p14.3–15.3 (24–32 Mb) with the location of the HOXA gene cluster indicated by an asterisk (B). In each case the chromosome ideogram indicates the region expanded in the heatmaps with a square bracket. Consecutive, orthologous 100 kb regions are positioned on the y-axis with heatmap colours representing relatively open (blue) and closed (red) chromatin structures. Regions displaying significantly divergent chromatin structure are highlighted in yellow.

