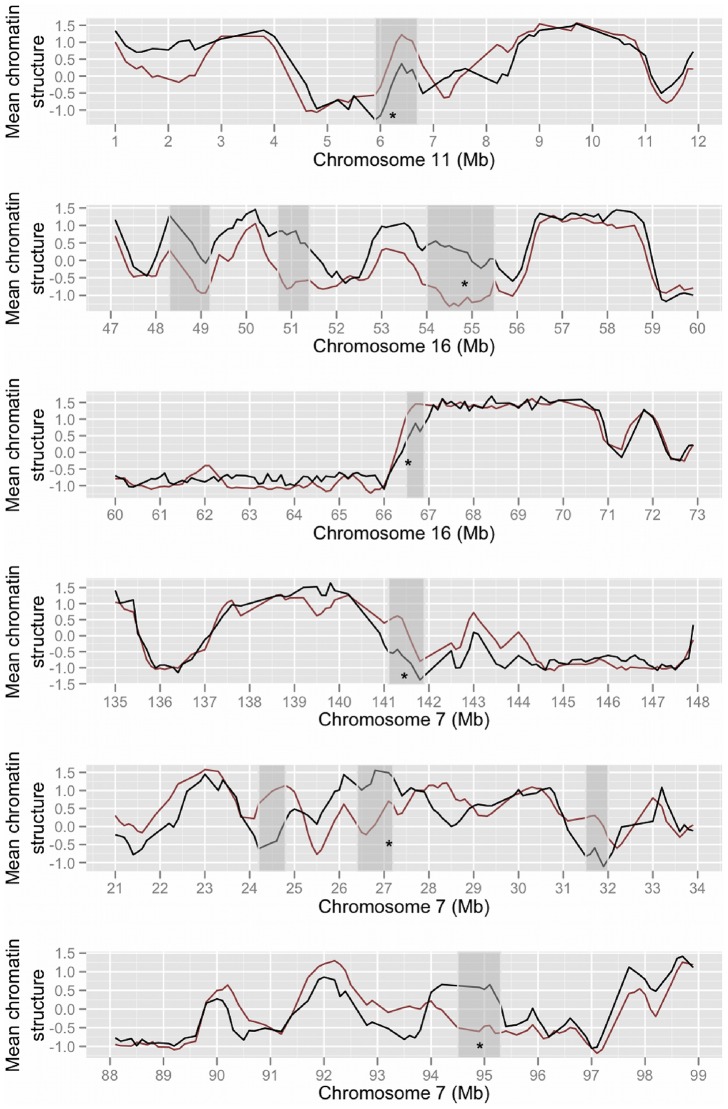
Figure 3. Clustering of divergent chromatin in the human genome.
The line plot shows mean normalised human (black) and mouse (red) higher order chromatin structure values across human chromosomes. Unexpectedly large divergent areas are highlighted in grey. Asterisks indicate the positions of functionally enriched gene clusters listed in Table 2.

