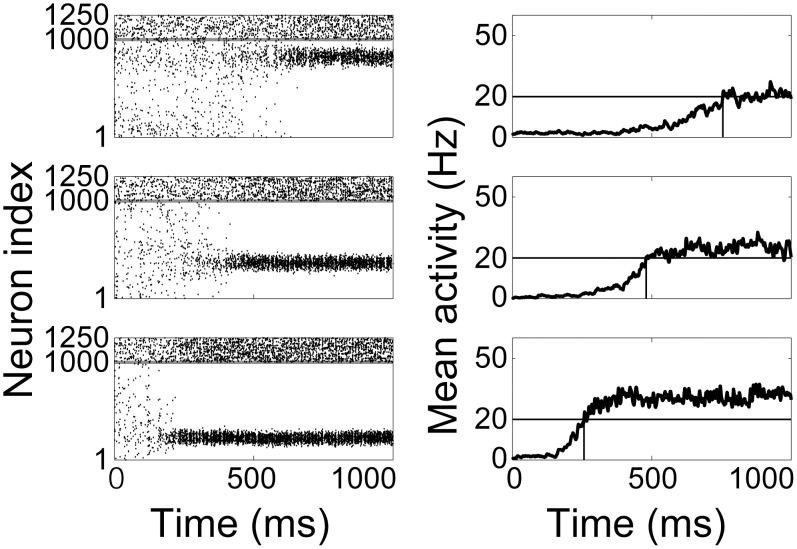
Figure 2. Raster plots (left) and mean SDFs over the ‘bump’ population (right) show the timing network coding temporal intervals with  (top),
  (middle) and
  (bottom).
Intervals were estimated when the mean SDF of the bump population reached 20 Hz. In raster plots, pyramidal neurons and inhibitory interneurons are indexed from 1–1000 and 1001–1250 respectively, indicated by the horizontal grey line.

