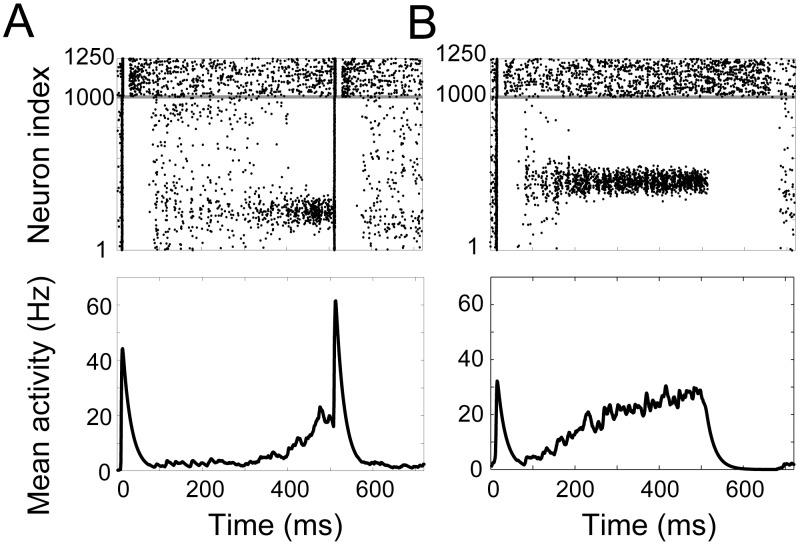
Figure 9. Starting and stopping the timing network.
In raster plots (upper), pyramidal neurons and inhibitory interneurons are indexed from 1–1000 and 1001–1250 respectively, indicted by the horizontal grey line. Lower plots show mean SDF of the bump population for the same simulations. See text for simulation details. (A) Brief, spatially non-selective excitation of all pyramidal neurons resets the network, regardless of its current state. (B) Brief, spatially non-selective excitation and inhibition of pyramidal neurons starts and stops activity in the timing network respectively.

