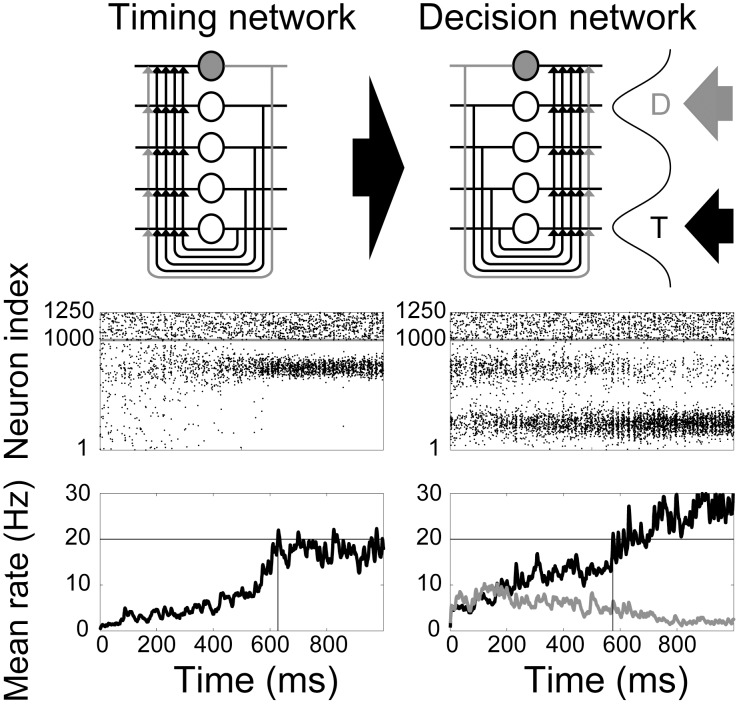
Figure 10. Gain modulation of the decision network (right) by the timing network (left).
(Top row) Each network schematic reproduces the schematic in Figure 1A. Climbing activity in the timing network provides spatially non-selective input to the decision network, depicted by the broad arrow. The decision network has Gaussian response fields for the target (T) and distractor (D) stimuli (see Methods), where the thinner arrows depict incoming evidence. (Middle row) Raster plots for each network during a single trial of the decision task with  and task difficulty
  . Pyramidal neurons and inhibitory interneurons are indexed from 1–1000 and 1001–1250 respectively, indicated by the horizontal grey line. Neurons 250 and 750 are the centres of the target and distractor RFs respectively. (Bottom row) Mean SDFs over the bump population in the timing network and the target and distractor populations in the decision network (see Methods). Black horizontal lines indicate the 20 Hz threshold used for interval estimation and decision making in the respective networks. Vertical lines show the time of threshold-crossing.

