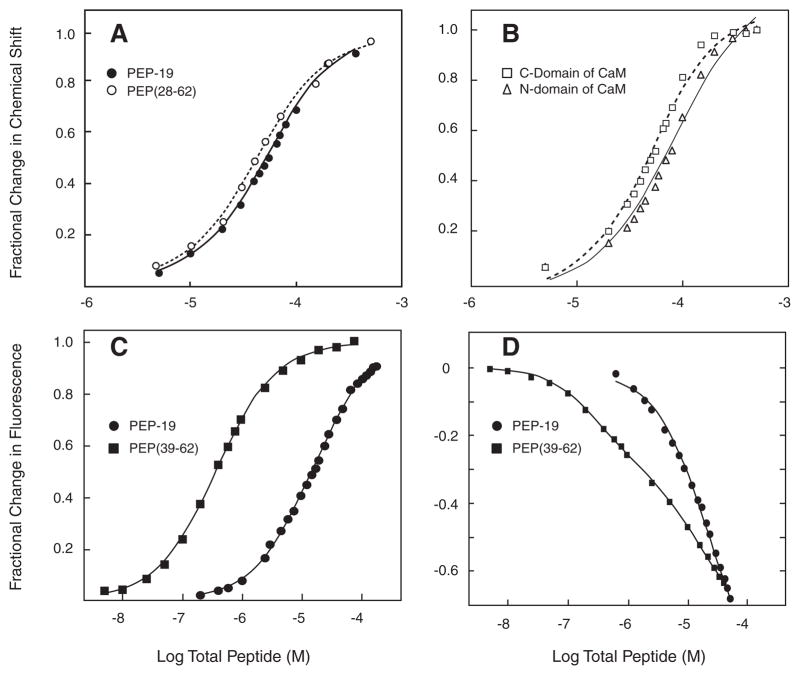
FIGURE 4. Equilibrium binding of PEP-19 polypeptides to CaM.
Panel A shows the fractional change in amide chemical shifts in the C-domain of Ca2+-CaM as a function of increasing concentrations of either PEP-19 (closed circles) or PEP(28–62) (open circles). The data represent the average fractional change for 1H and or 15N nuclei for residues 99, 105, 109, 116, 121, 146, and 147. The line represents the fit to a single-site binding model described under “Experimental Procedures.” Panel B shows the average fractional change in chemical shifts for residues 5, 17, 19, 21 29, 33, 44, 53, 55, 57, 64, 70, and 73 in the N-domain (open squares) and residues 94, 105, 106, 110, 116, 117, 130, 137, 146, 147, and 148 in the C-domain (open triangles) of Ca2+-CaM as a function of increasing concentrations of PEP(39–62). Chemical shift changes in response to PEP(39–62) did not fit well to a single-site binding model. Panel C shows the change in fluorescence from CaMACR upon titration with PEP-19 or PEP(39–62). Panel D shows titration of IAEDANS-labeled CaM(T110C) with DDPM-labeled PEP-19 or PEP(39–62). Labeled CaM for experiments in both panels C and D was present at 0.05 or 0.5 μM for titration with PEP(39–62) or PEP-19, respectively.

