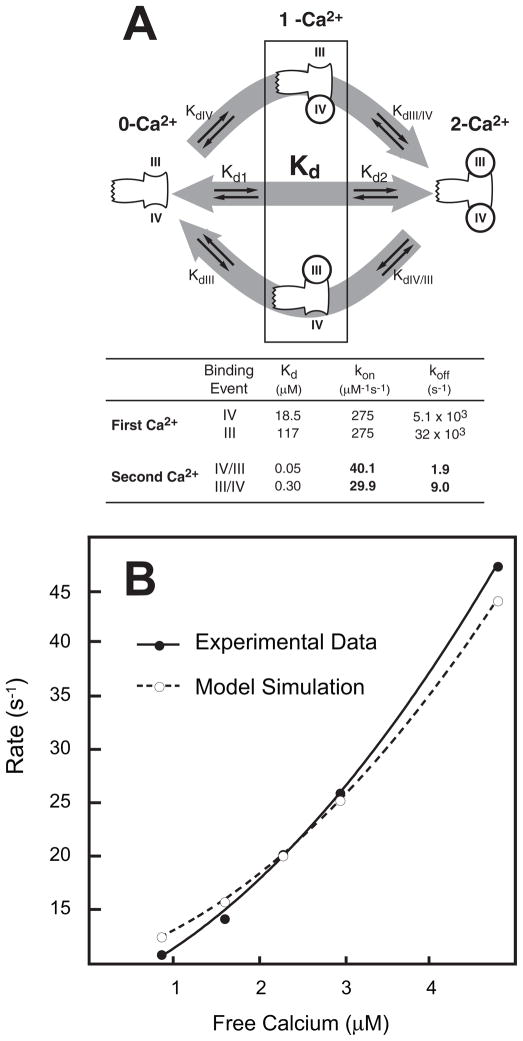
FIGURE 6. Cooperative Ca2+ binding to the C-domain of CaM.
Panel A illustrates the microscopic equilibrium Ca2+ binding reactions associated with transition of the C-domain of CaM from the 0-Ca2+ to 2-Ca2+ states. The table in panel A lists optimized equilibrium and kinetic microscopic Ca2+ binding constants derived as described under “Experimental Procedures.” Panel B shows the relationship between observed Ca2+ association rates at free Ca2+ in the range of 1 to 5 μM. The closed circles are experimental data derived as described in the legend to Fig. 5E and under “Experimental Procedures.” The open circles are derived from a simulation carried out using the model described under “Experimental Procedures” and the binding parameters shown in panel A.

