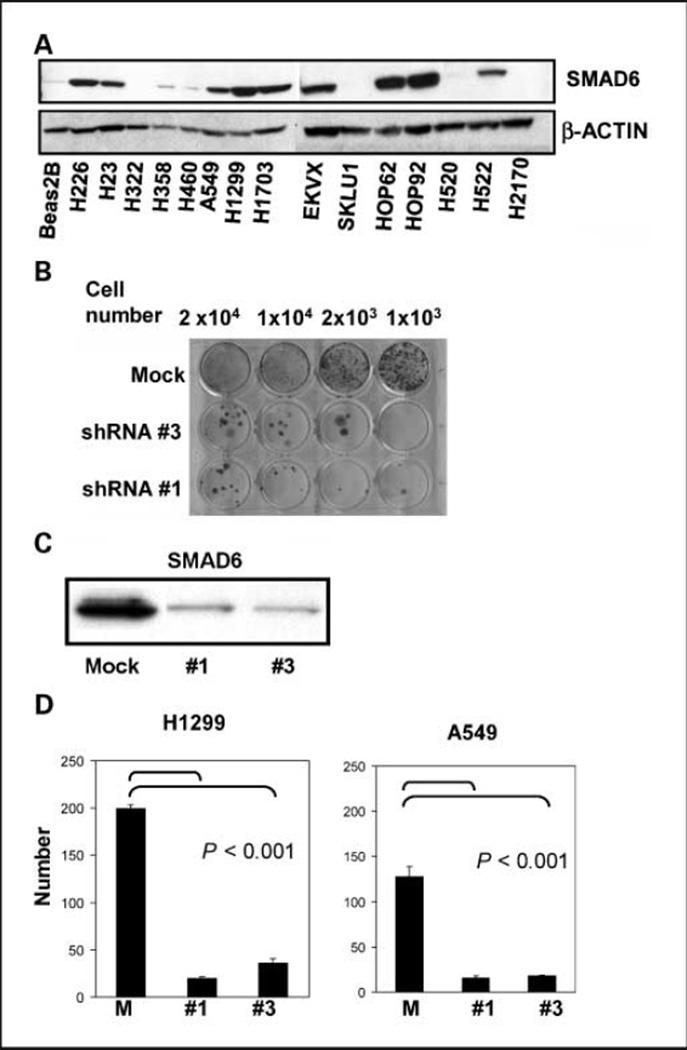
Figure 2.
SMAD6 expression and knockdown in lung cancer and normal cell lines. A, expression of SMAD6 in normal lung cells (Beas2B) and indicated lung cancer cell lines. B, cell viability assay in H1299 cells after SMAD6 knockdown. Control (mock) lentivirus or SMAD6 shRNA #1–transduced and shRNA #3–transduced H1299 cells were seeded at indicated densities and stained with crystal violet 10 d after infection. C, Western blot analysis showing SMAD6 levels in transduced cells as indicated. D, colony formation on soft agar in H1299 and A549 cells that were transduced with SMAD6 shRNA #1, shRNA #3, and mock control. Histograms indicate stained soft agar colonies counted from three independent experiments. Bars, SD. P values are as indicated when compared with mock control. Lentiviruses are the same as for B.

