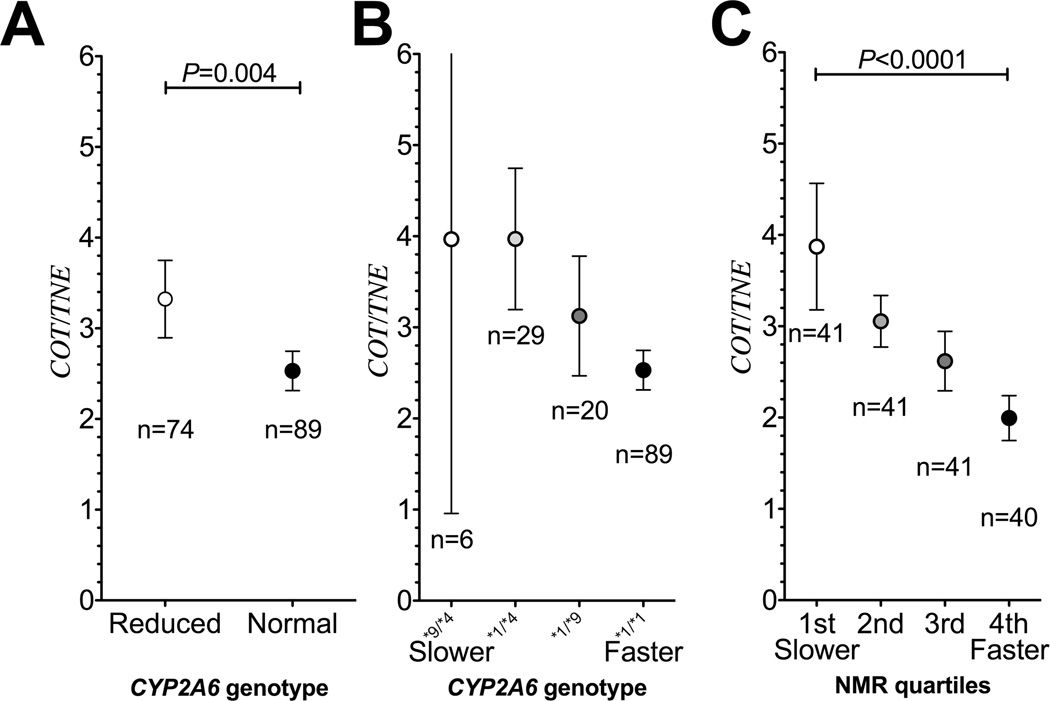
Figure 3.
A. The cotinine to TNE ratio (i.e. cotinine levels per nicotine intake) was significantly lower in CYP2A6 NM compared to the CYP2A6 RM. (Study 2) B. The cotinine to TNE ratio decreased with CYP2A6 genotypes with increasing activity (Study 2). As illustrated using some different CYP2A6 genotypes, containing reduced function (*9) or loss of function (*4) allele compared to the wild type individuals (*1/*1). Of note, individuals who are fully null for CYP2A6 (i.e. these with two copies of gene deletions, CYP2A6*4/*4) had unexpectedly lower COT to TNE ratio compared to the wild-type individuals (*1/*1, data not shown), suggesting the minor remaining cotinine formation pathway (likely CYP2B6 or CYP2A13) is considerably slower than the low affinity cotinine removal pathway (likely UGT2B10 glucuronidation or renal clearance). C. The cotinine to TNE ratio decreased by NMR quartiles (Study 2). Data presented as mean ± 95% confident intervals. Statistical comparisons were performed by Mann Whitney or Kruskal-Wallis tests.

