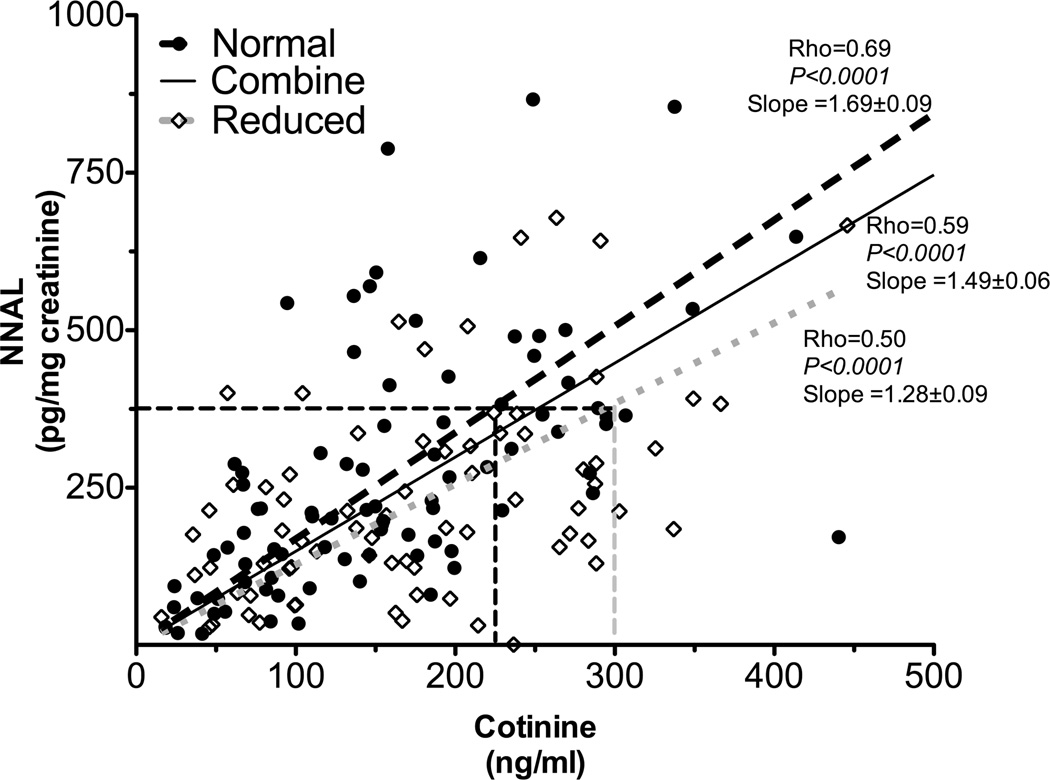
Figure 4.
Cotinine’s ability to predict tobacco specific nitrosamines exposure (as indicated by NNAL levels) was different between CYP2A6 genotypes (Study 2). The slope between urinary NNAL levels and plasma cotinine was significantly lower in CYP2A6 reduced metabolizers (n=74) compared to that of CYP2A6 normal metabolizers (n=89, supplementary table 2B). This suggested the quantitative relationship between cotinine and tobacco specific nitrosamines exposure differed between CYP2A6 genotypes. The numbers after the slopes are standard error.

