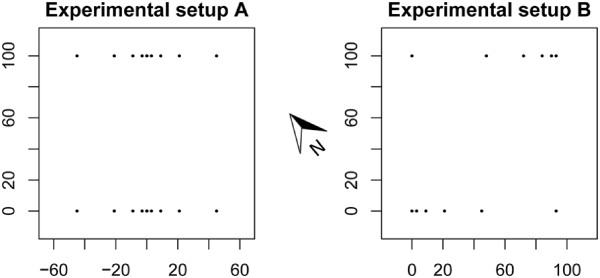
Figure 1.

Experimental setup. Experimental setup A and B. The plots show the study area viewed from above. Distance units are meters. Traps are represented by black dots. All traps were hung with the light tubes along the transect line. In setup A, the middle dot represents two traps separated by 12 cm. In setup B, the configuration was rotated 90 degrees in some time intervals.
